Prometheus Kubernetes monitoring
Prometheus is an open source monitoring and alerting toolkit for containers and microservices
Introduction
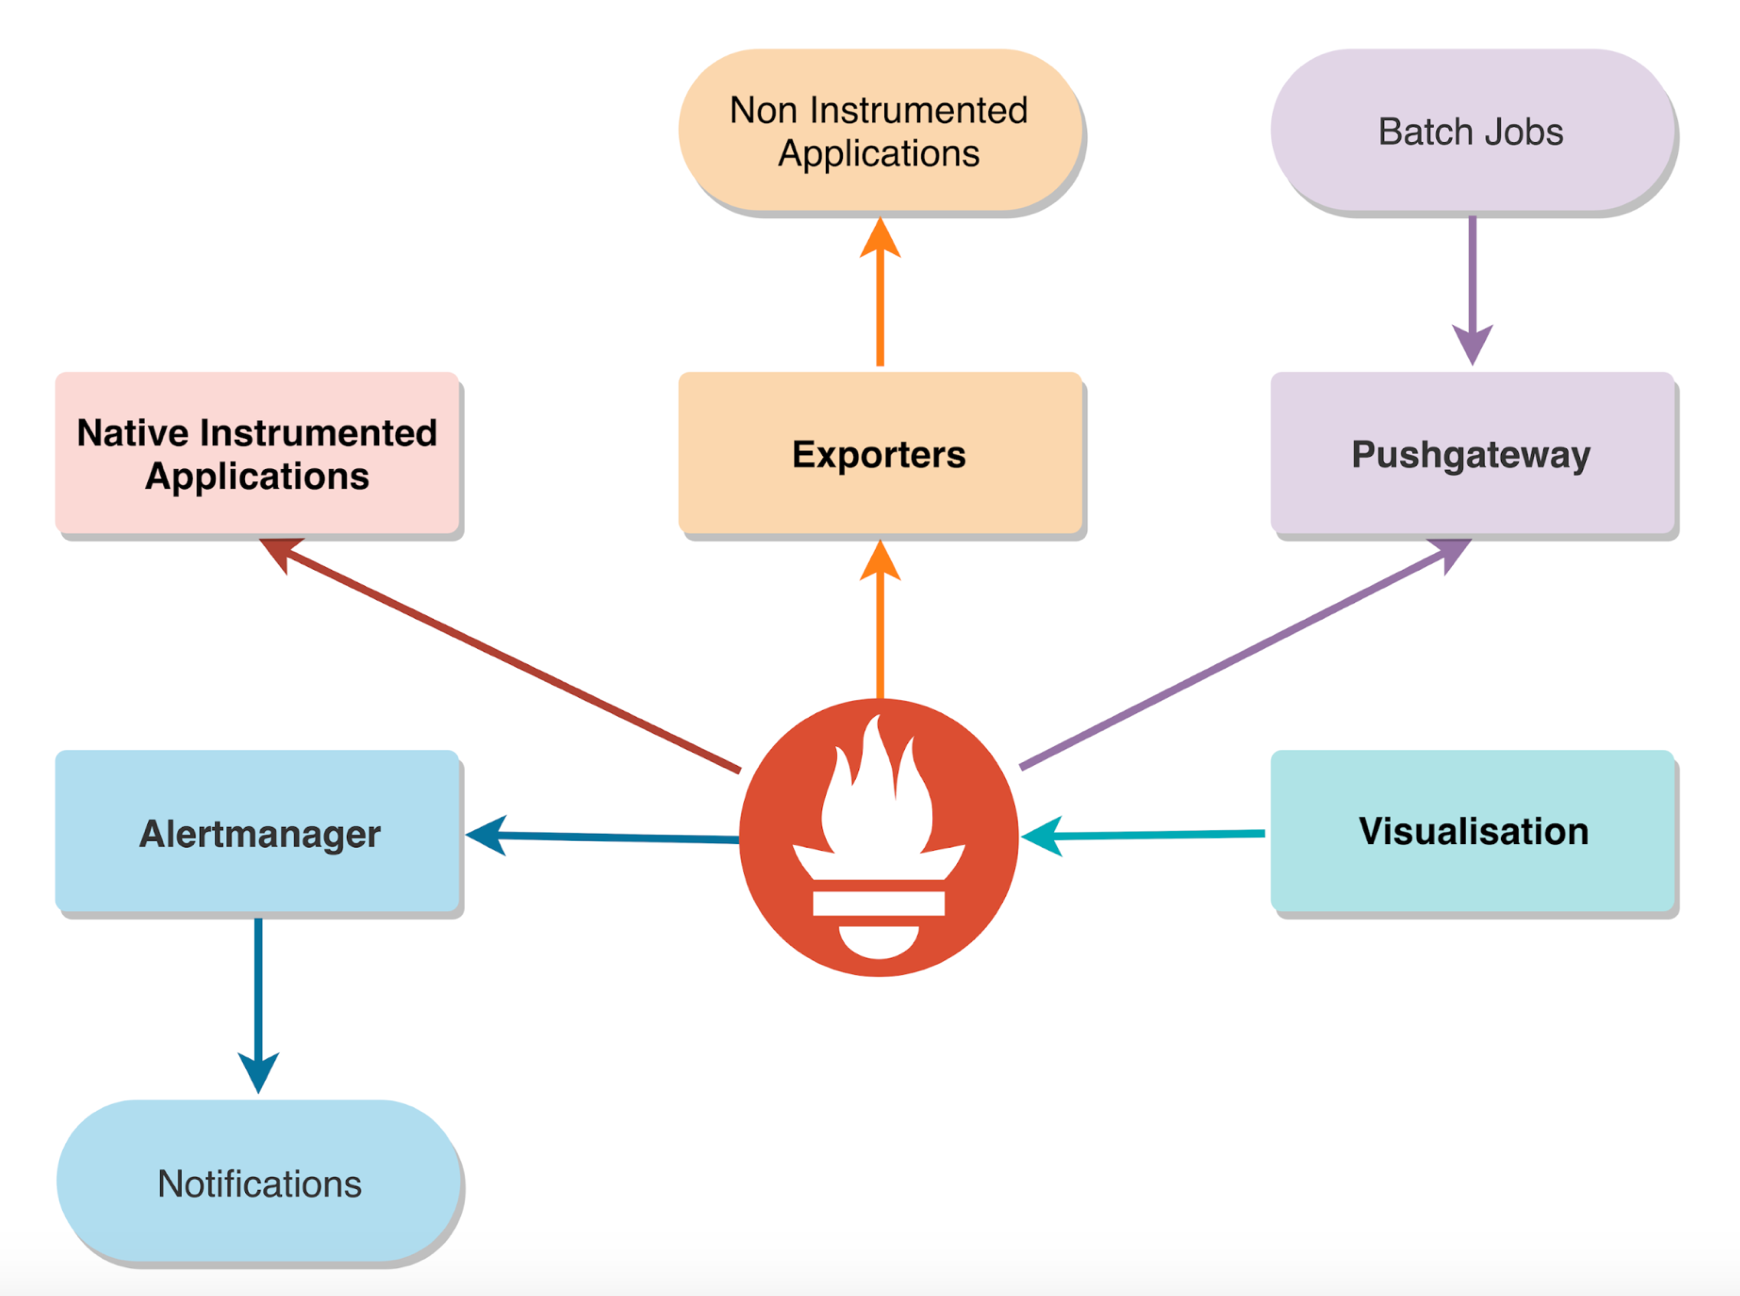
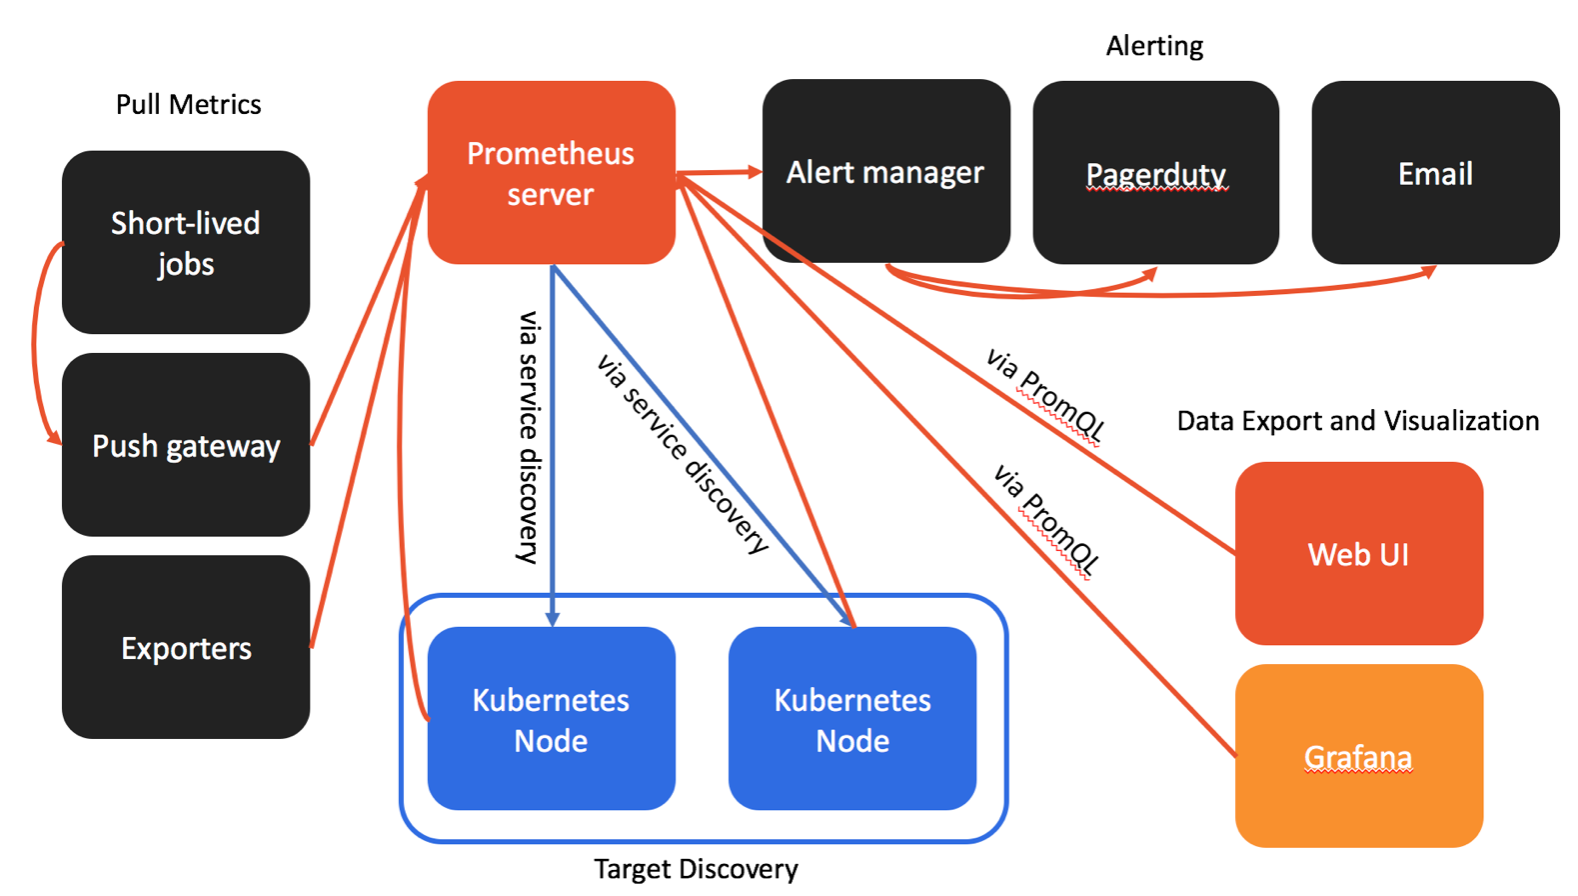
Based on the organizations that have adopted it, Prometheus has become the mainstream open source monitoring tool of choice for those that lean heavily on containers and microservices. Prometheus is part of the Cloud Native Computing Foundation. The Prometheus ecosystem consists of multiple components, many of which are optional: the main Prometheus server which gathers and stores time series data. client libraries for instrumenting application code. a push gateway for supporting short-lived jobs. special-purpose exporters for services like HAProxy, StatsD, Graphite, etc. an alertmanager to handle alerts. various support tools.
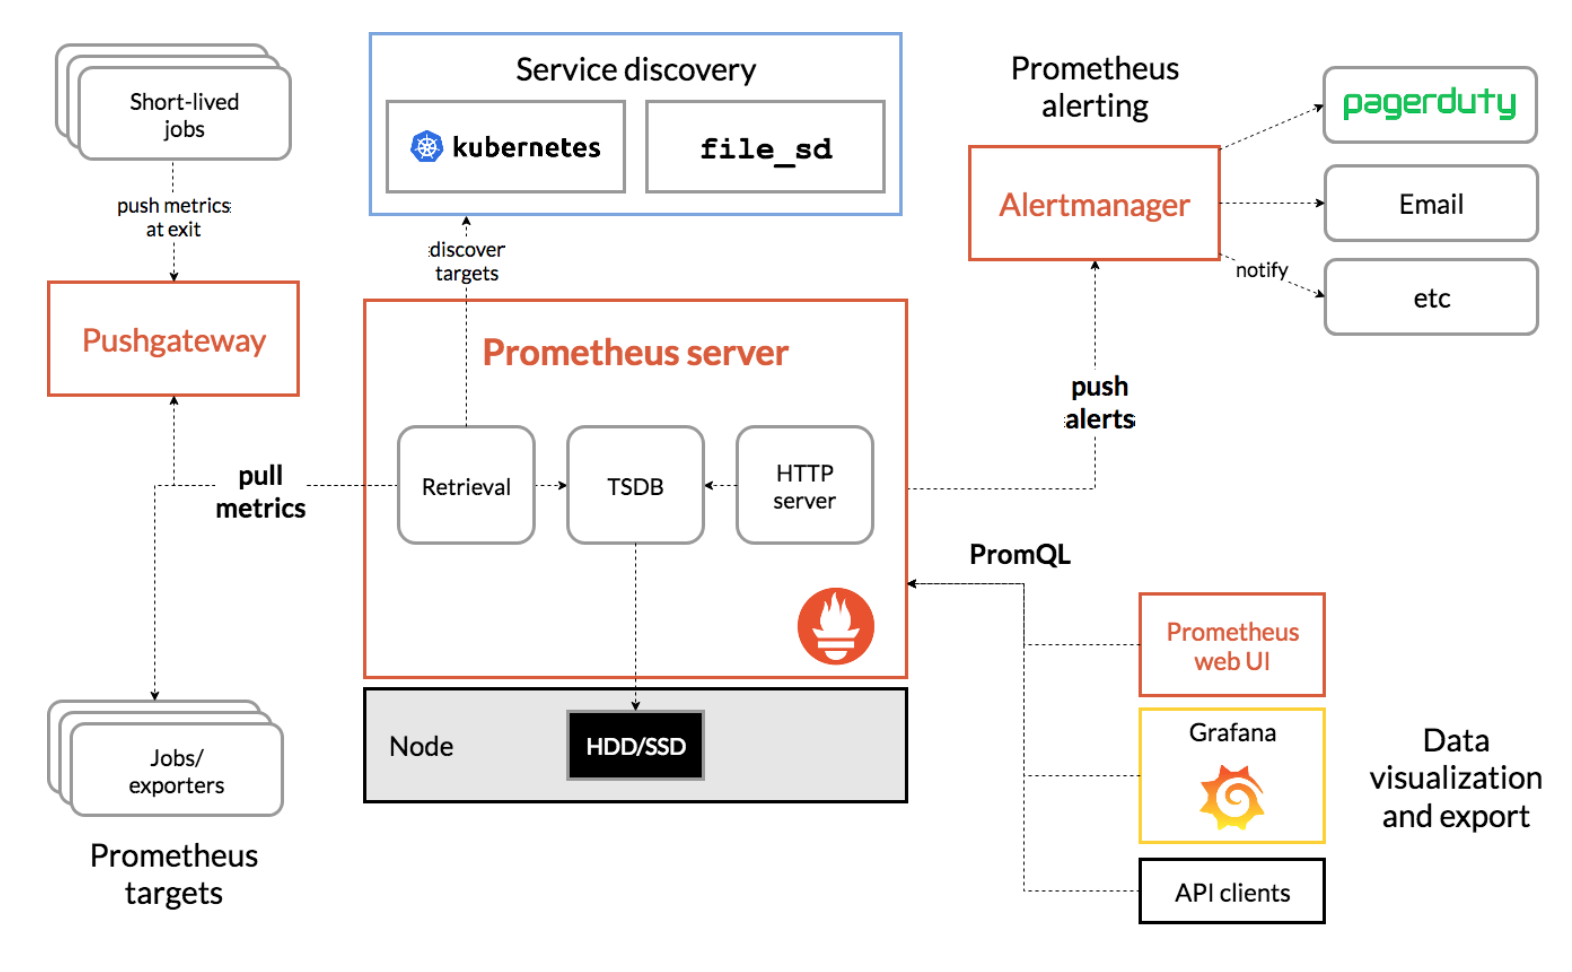
Please find further details at: https://prometheus.io/docs/introduction/overview/
Exporters
An exporter is nothing more than a piece of software that collects data from a service or application and exposes it via HTTP in the Prometheus format. Each exporter usually targets a specific service or application and as such, their deployment reflects this one-to-one synergy. When the exporter starts, it binds to a configured port and exposes the internal state of whatever is being collected in an HTTP endpoint of your choosing (the default is /metrics). The instrumentation data is collected when an HTTP GET request is made to the configured endpoint. For example, node exporter, one of the most commonly used exporters, relies on a number of kernel statistics to present data such as disk I/O, CPU, memory, network, filesystem usage, and much, much more. Every single time that endpoint is scraped, the information is quickly gathered and exposed in a synchronous operation. If you are the one writing the service, the best option is to instrument the code directly using a Prometheus client library. There are official client libraries available for the following programming languages: Python, Java, Node.js, etc.
Alert Manager
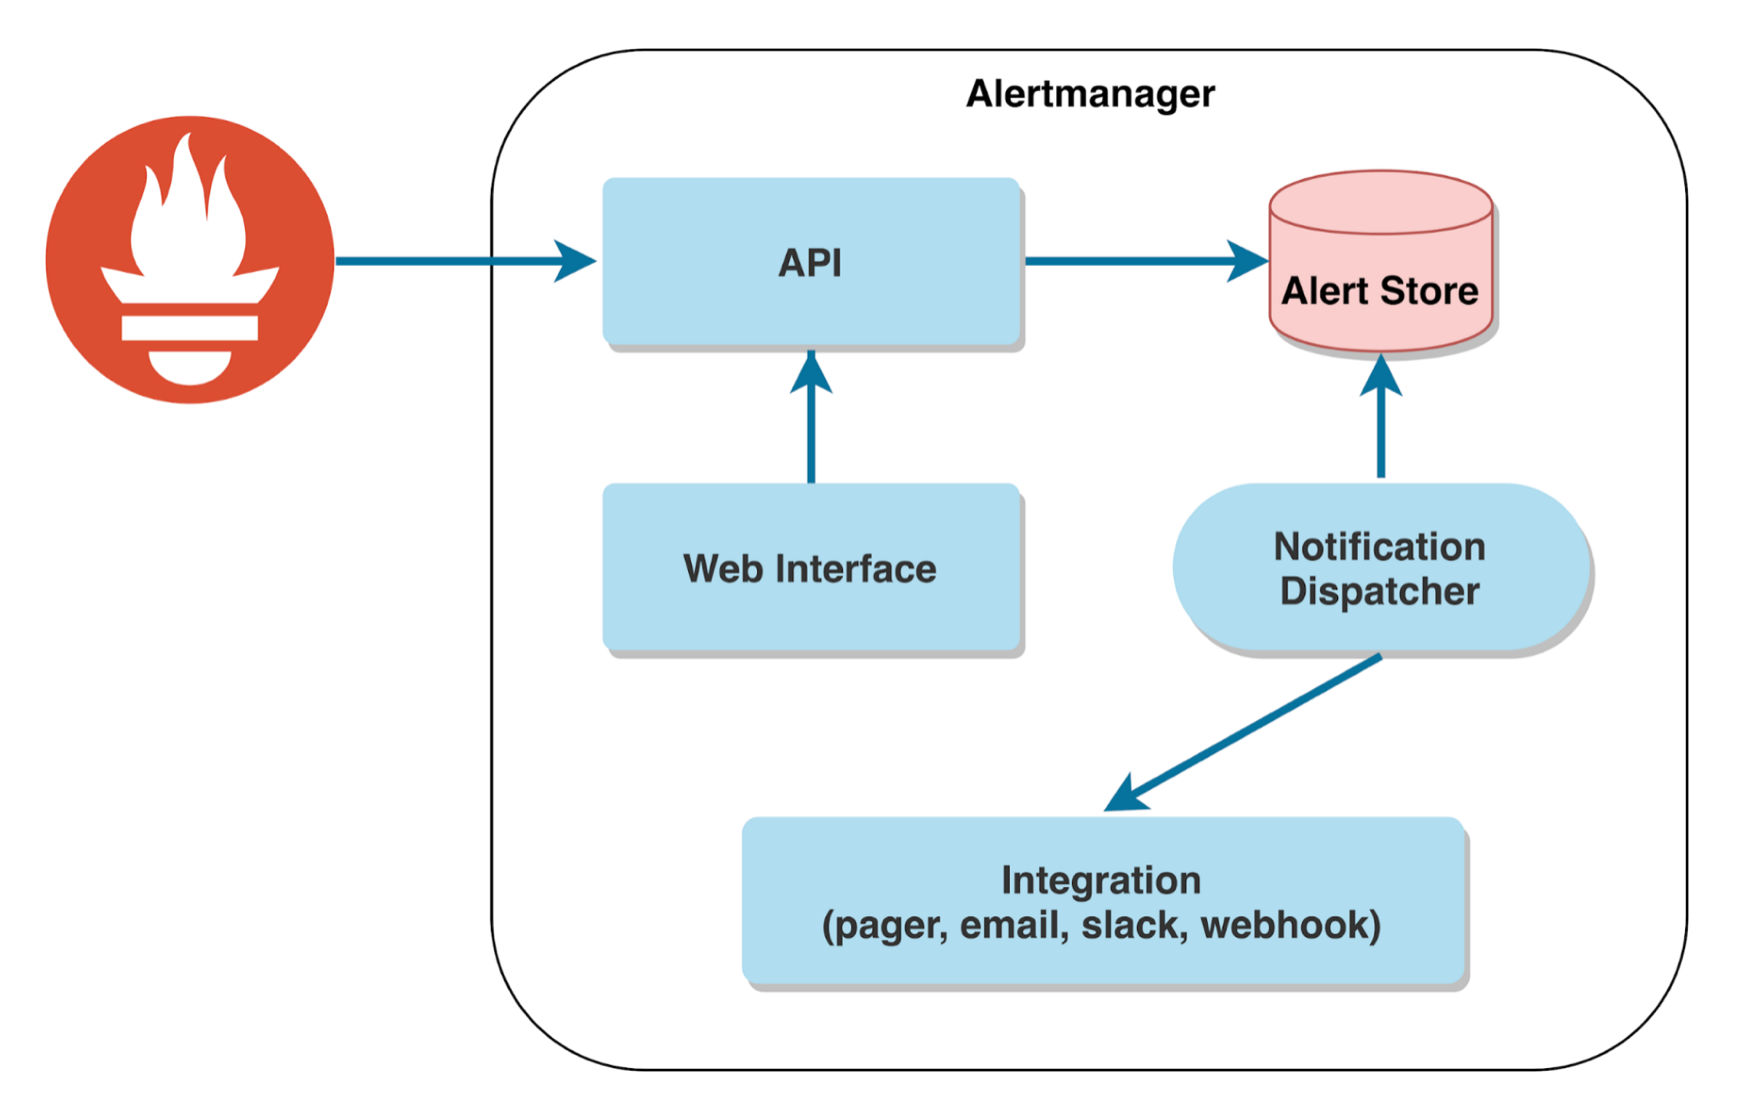
Alertmanager is a service that receives HTTP POST requests from Prometheus servers via its API, which it then deduplicates and acts on by following a predefined set of routes. Alertmanager also exposes a web interface to allow, for instance, the visualization and silencing of firing alerts or applying inhibition rules for them. There are multiple out-of-the-box integrations available for the most common use cases, such as the following: email, Slack, etc.
Visualisation
As mentioned above, Prometheus ships its own Web UI for exporting and visualising data.
Prometheus provides this web UI for running basic queries located at http://
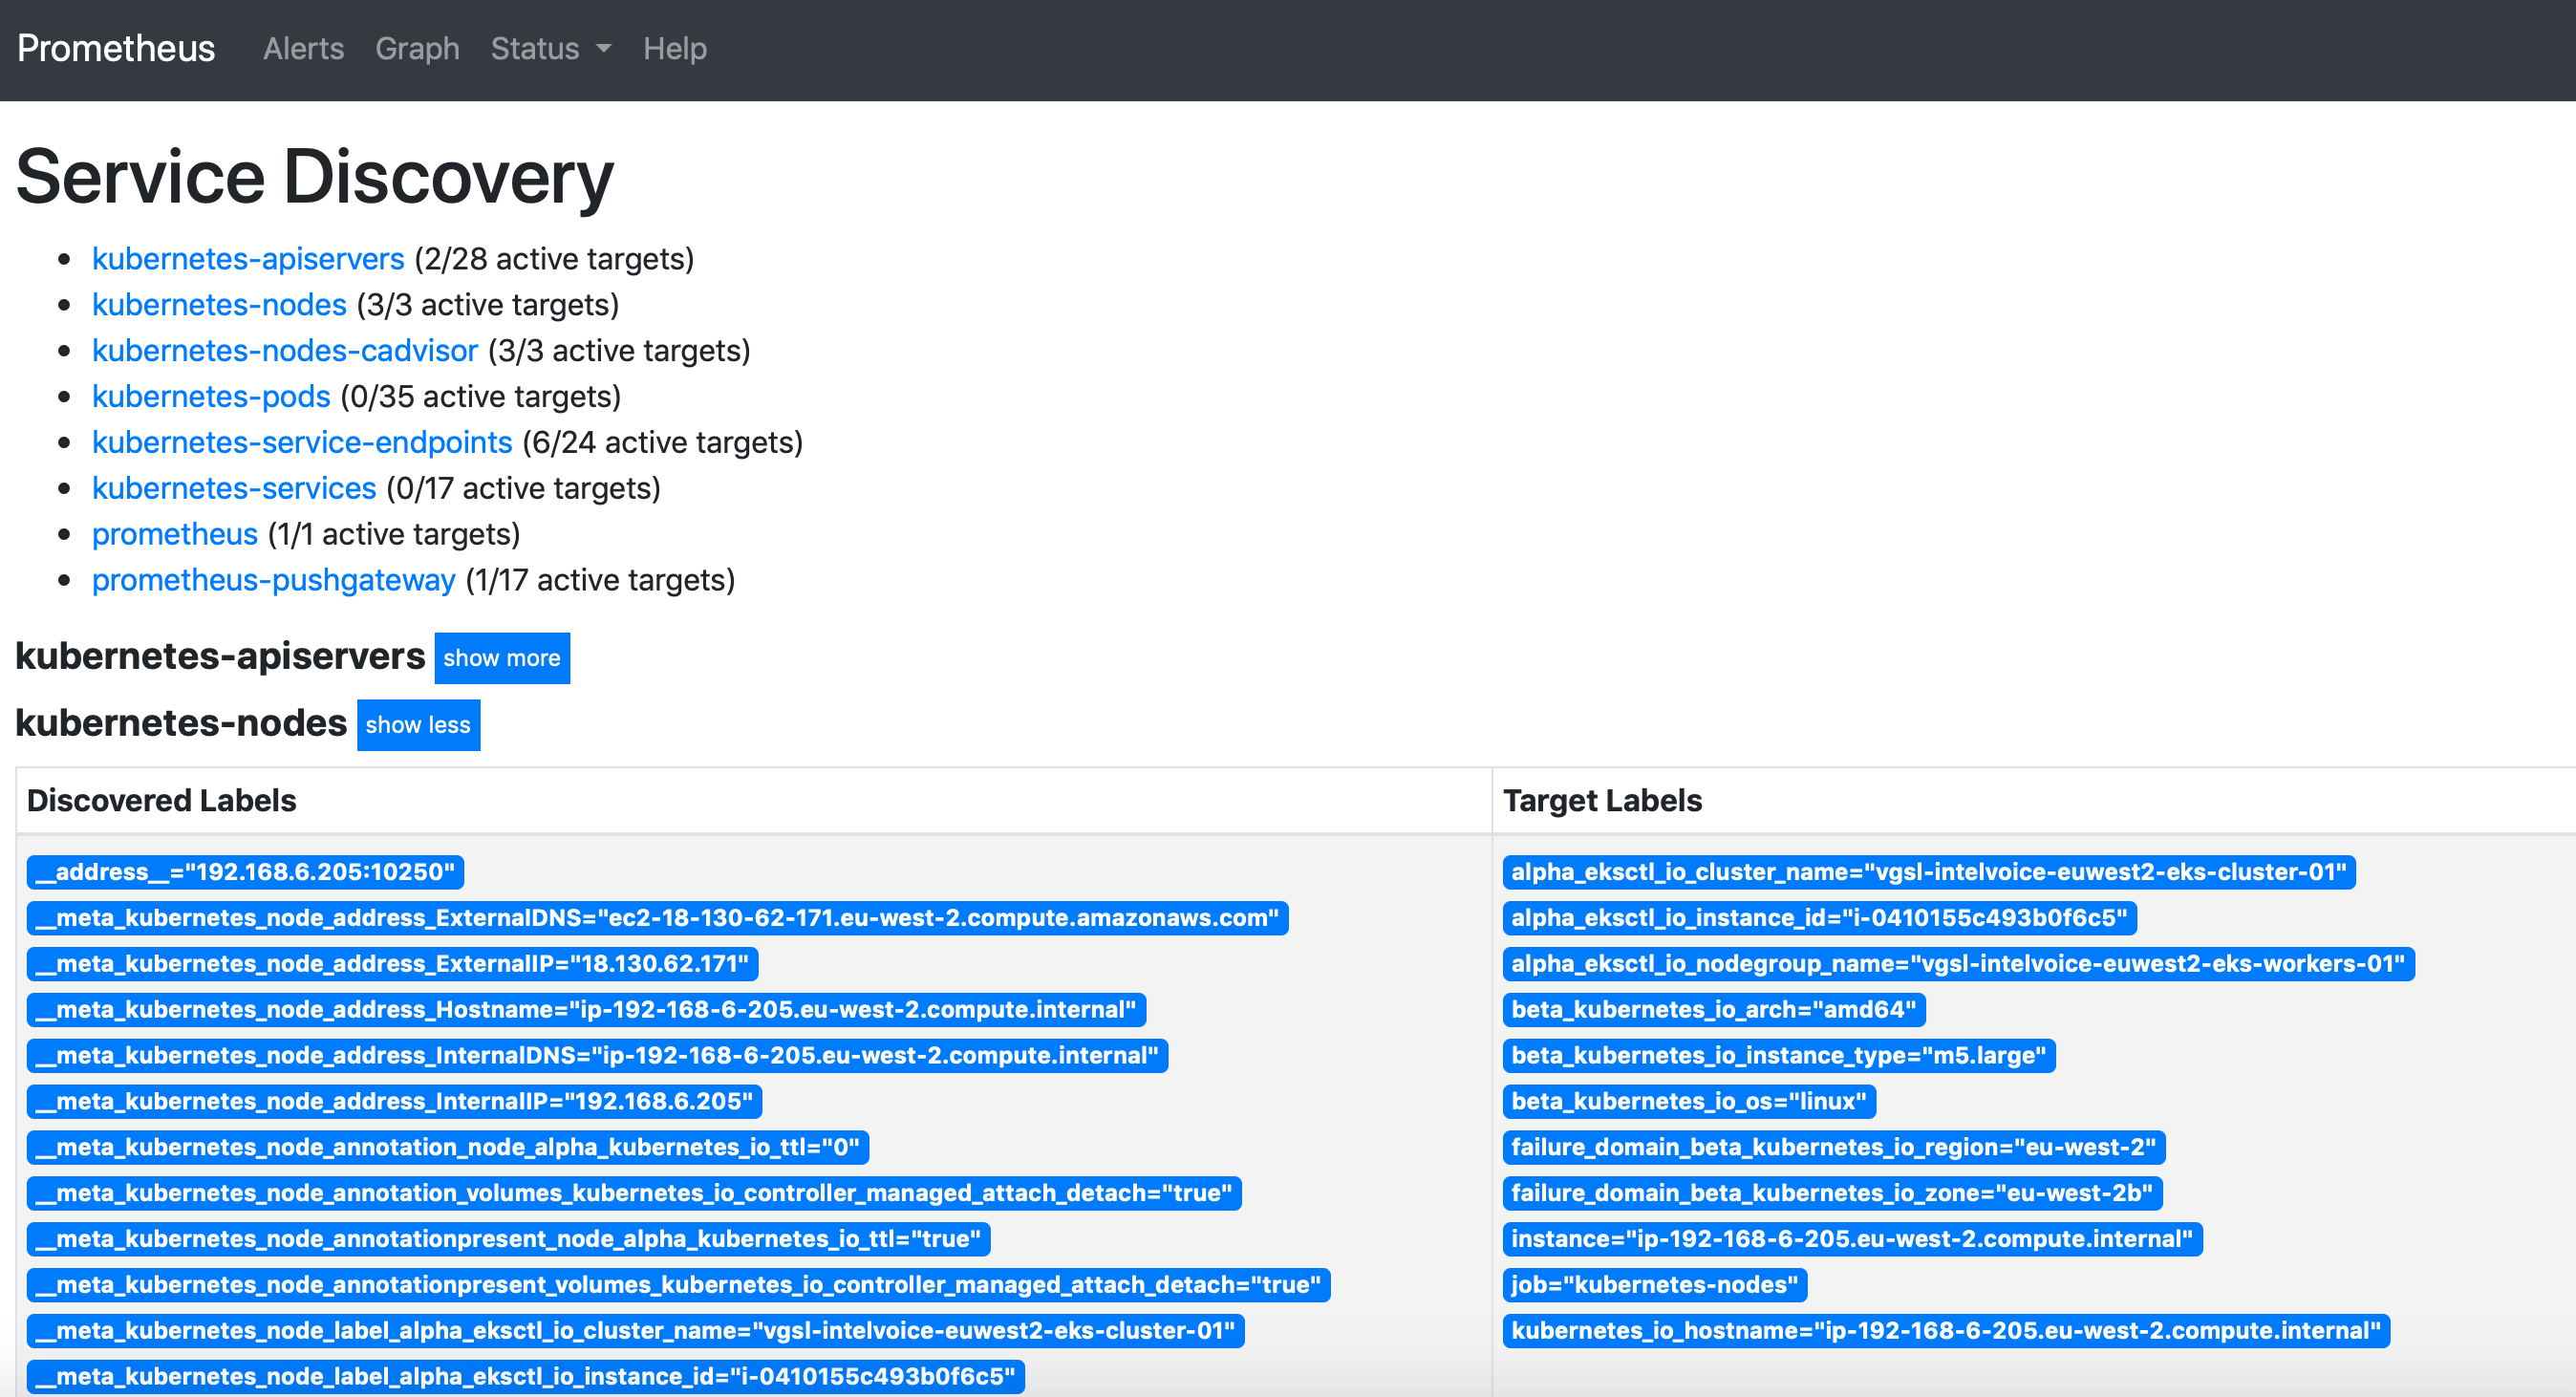
The default path /metrics displays the metrics available:

The Prometheus server collects metrics and stores them in a time series database. Individual metrics are identified with names such as “node_filesystem_avail”. A metric may have a number of “labels” attached to it, to distinguish it from other similar sources of metrics. In PromQL (Prometheus Query Language), an expression or subexpression should always evaluate to one of the following data types: Instant vector — It represents a time-varying value at a specific point of time. Range vector — it represents a time-varying value, over a period of time. Scalar — A simple numeric floating point value. String — A string value. String literals can be enclosed between single quotes, double quotes or backticks (`). However, escape sequences like \n are only processed when double quotes are used.
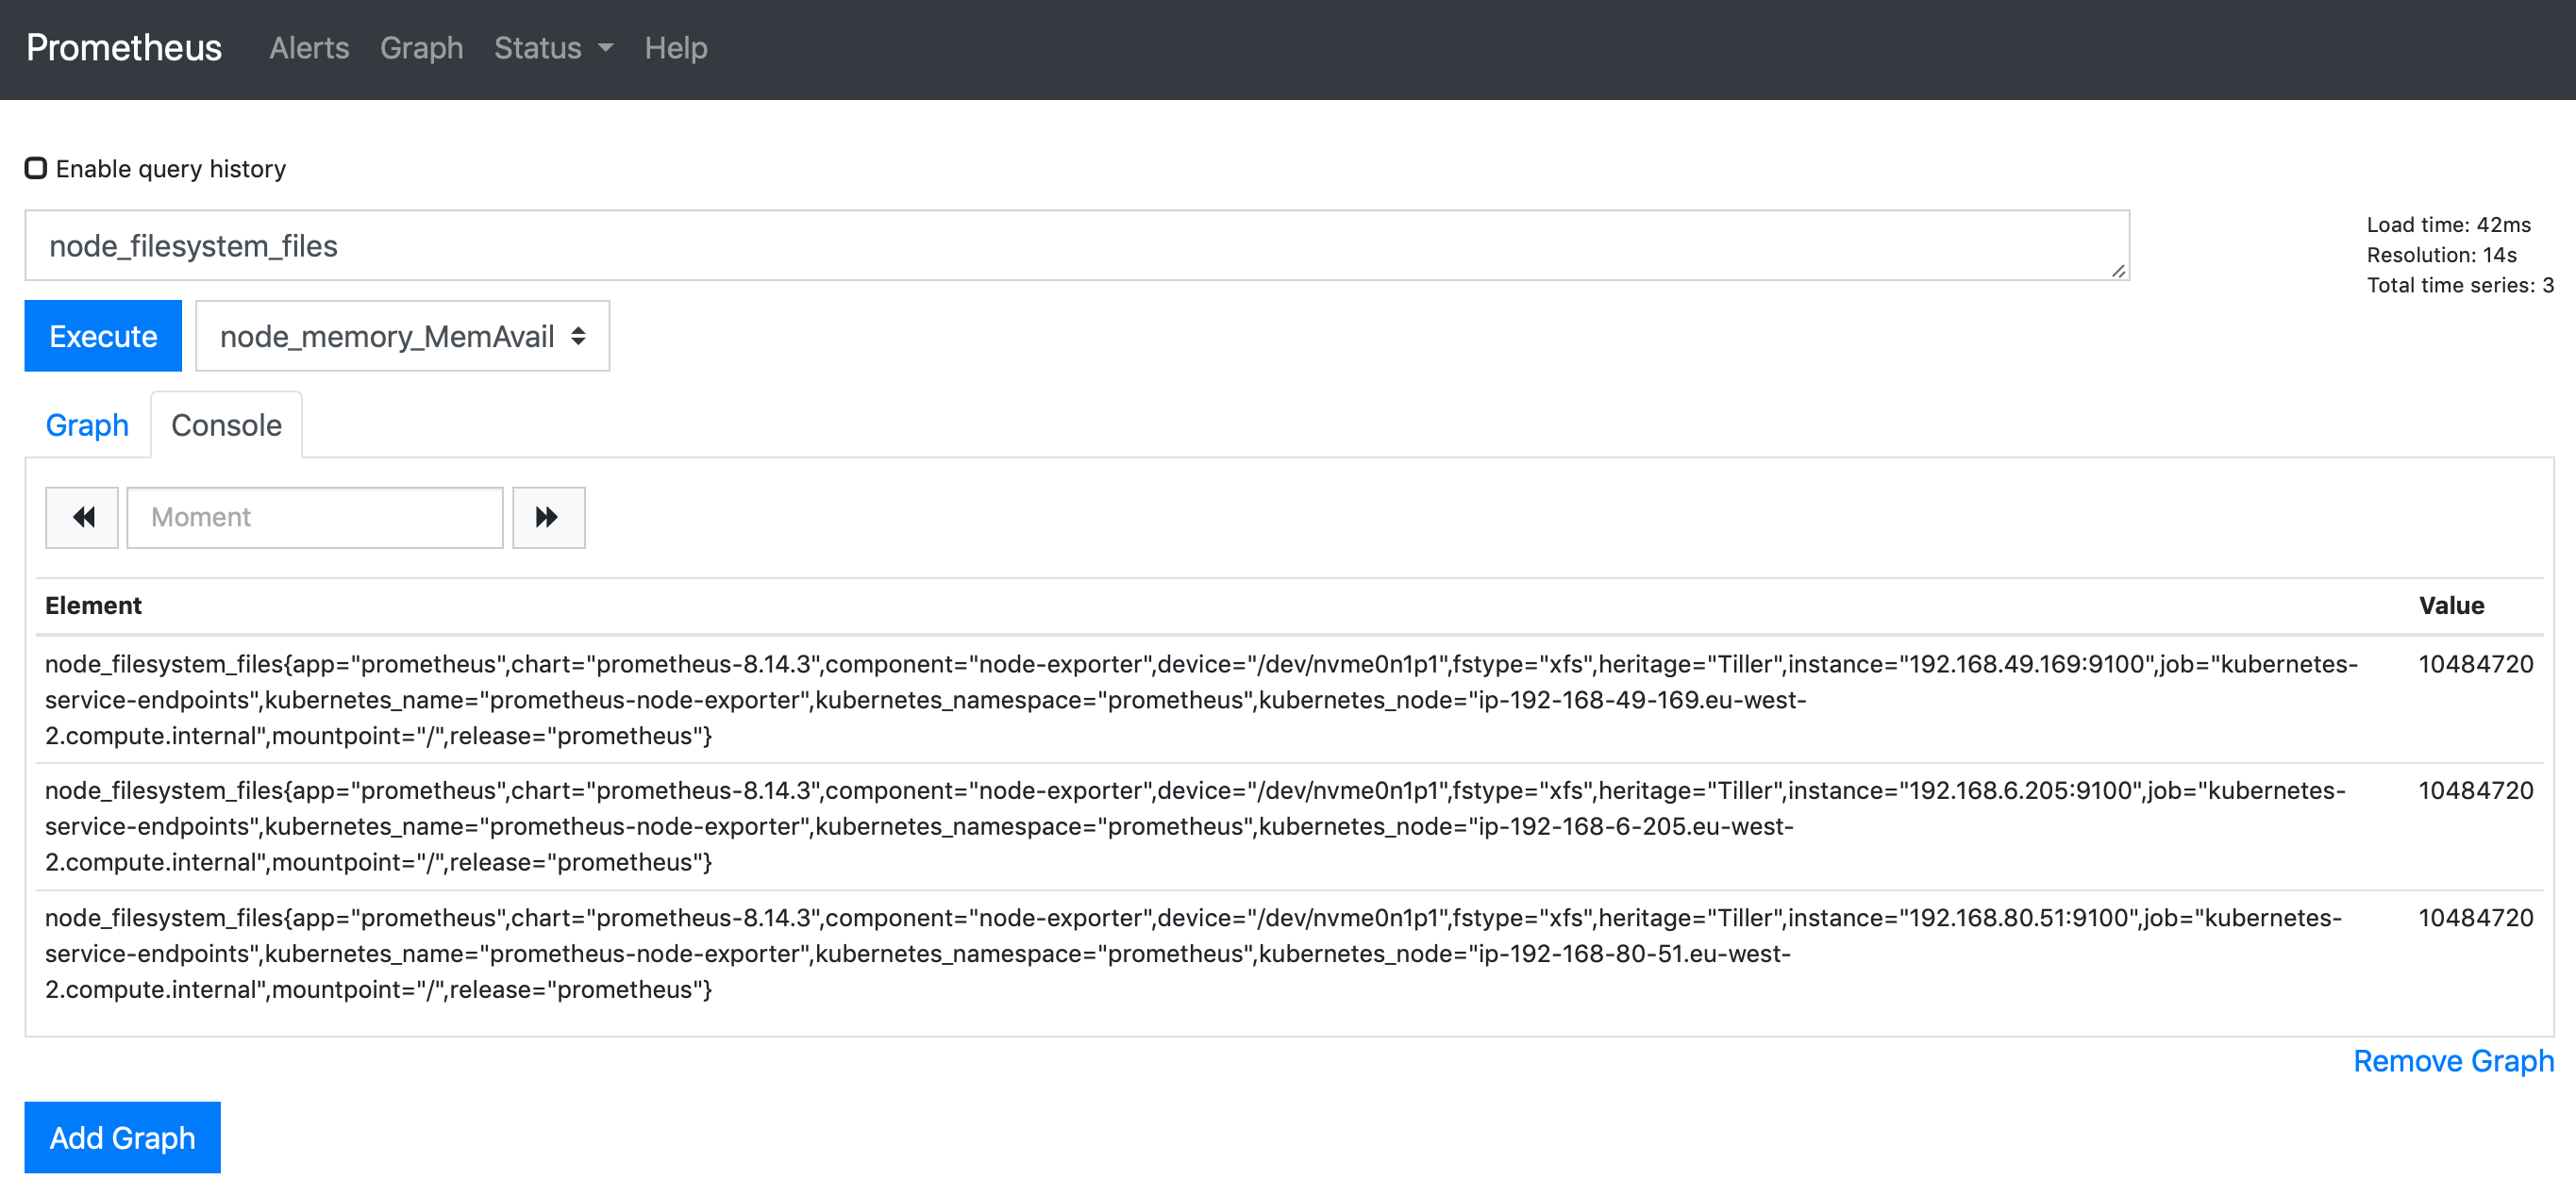
As an example, we have to find out the “node_filesystem_files” on a system. This metric is available as “node_filesystem_files”. Type this in the “Expression” field and hit Enter.
You can also get a graph of the data:
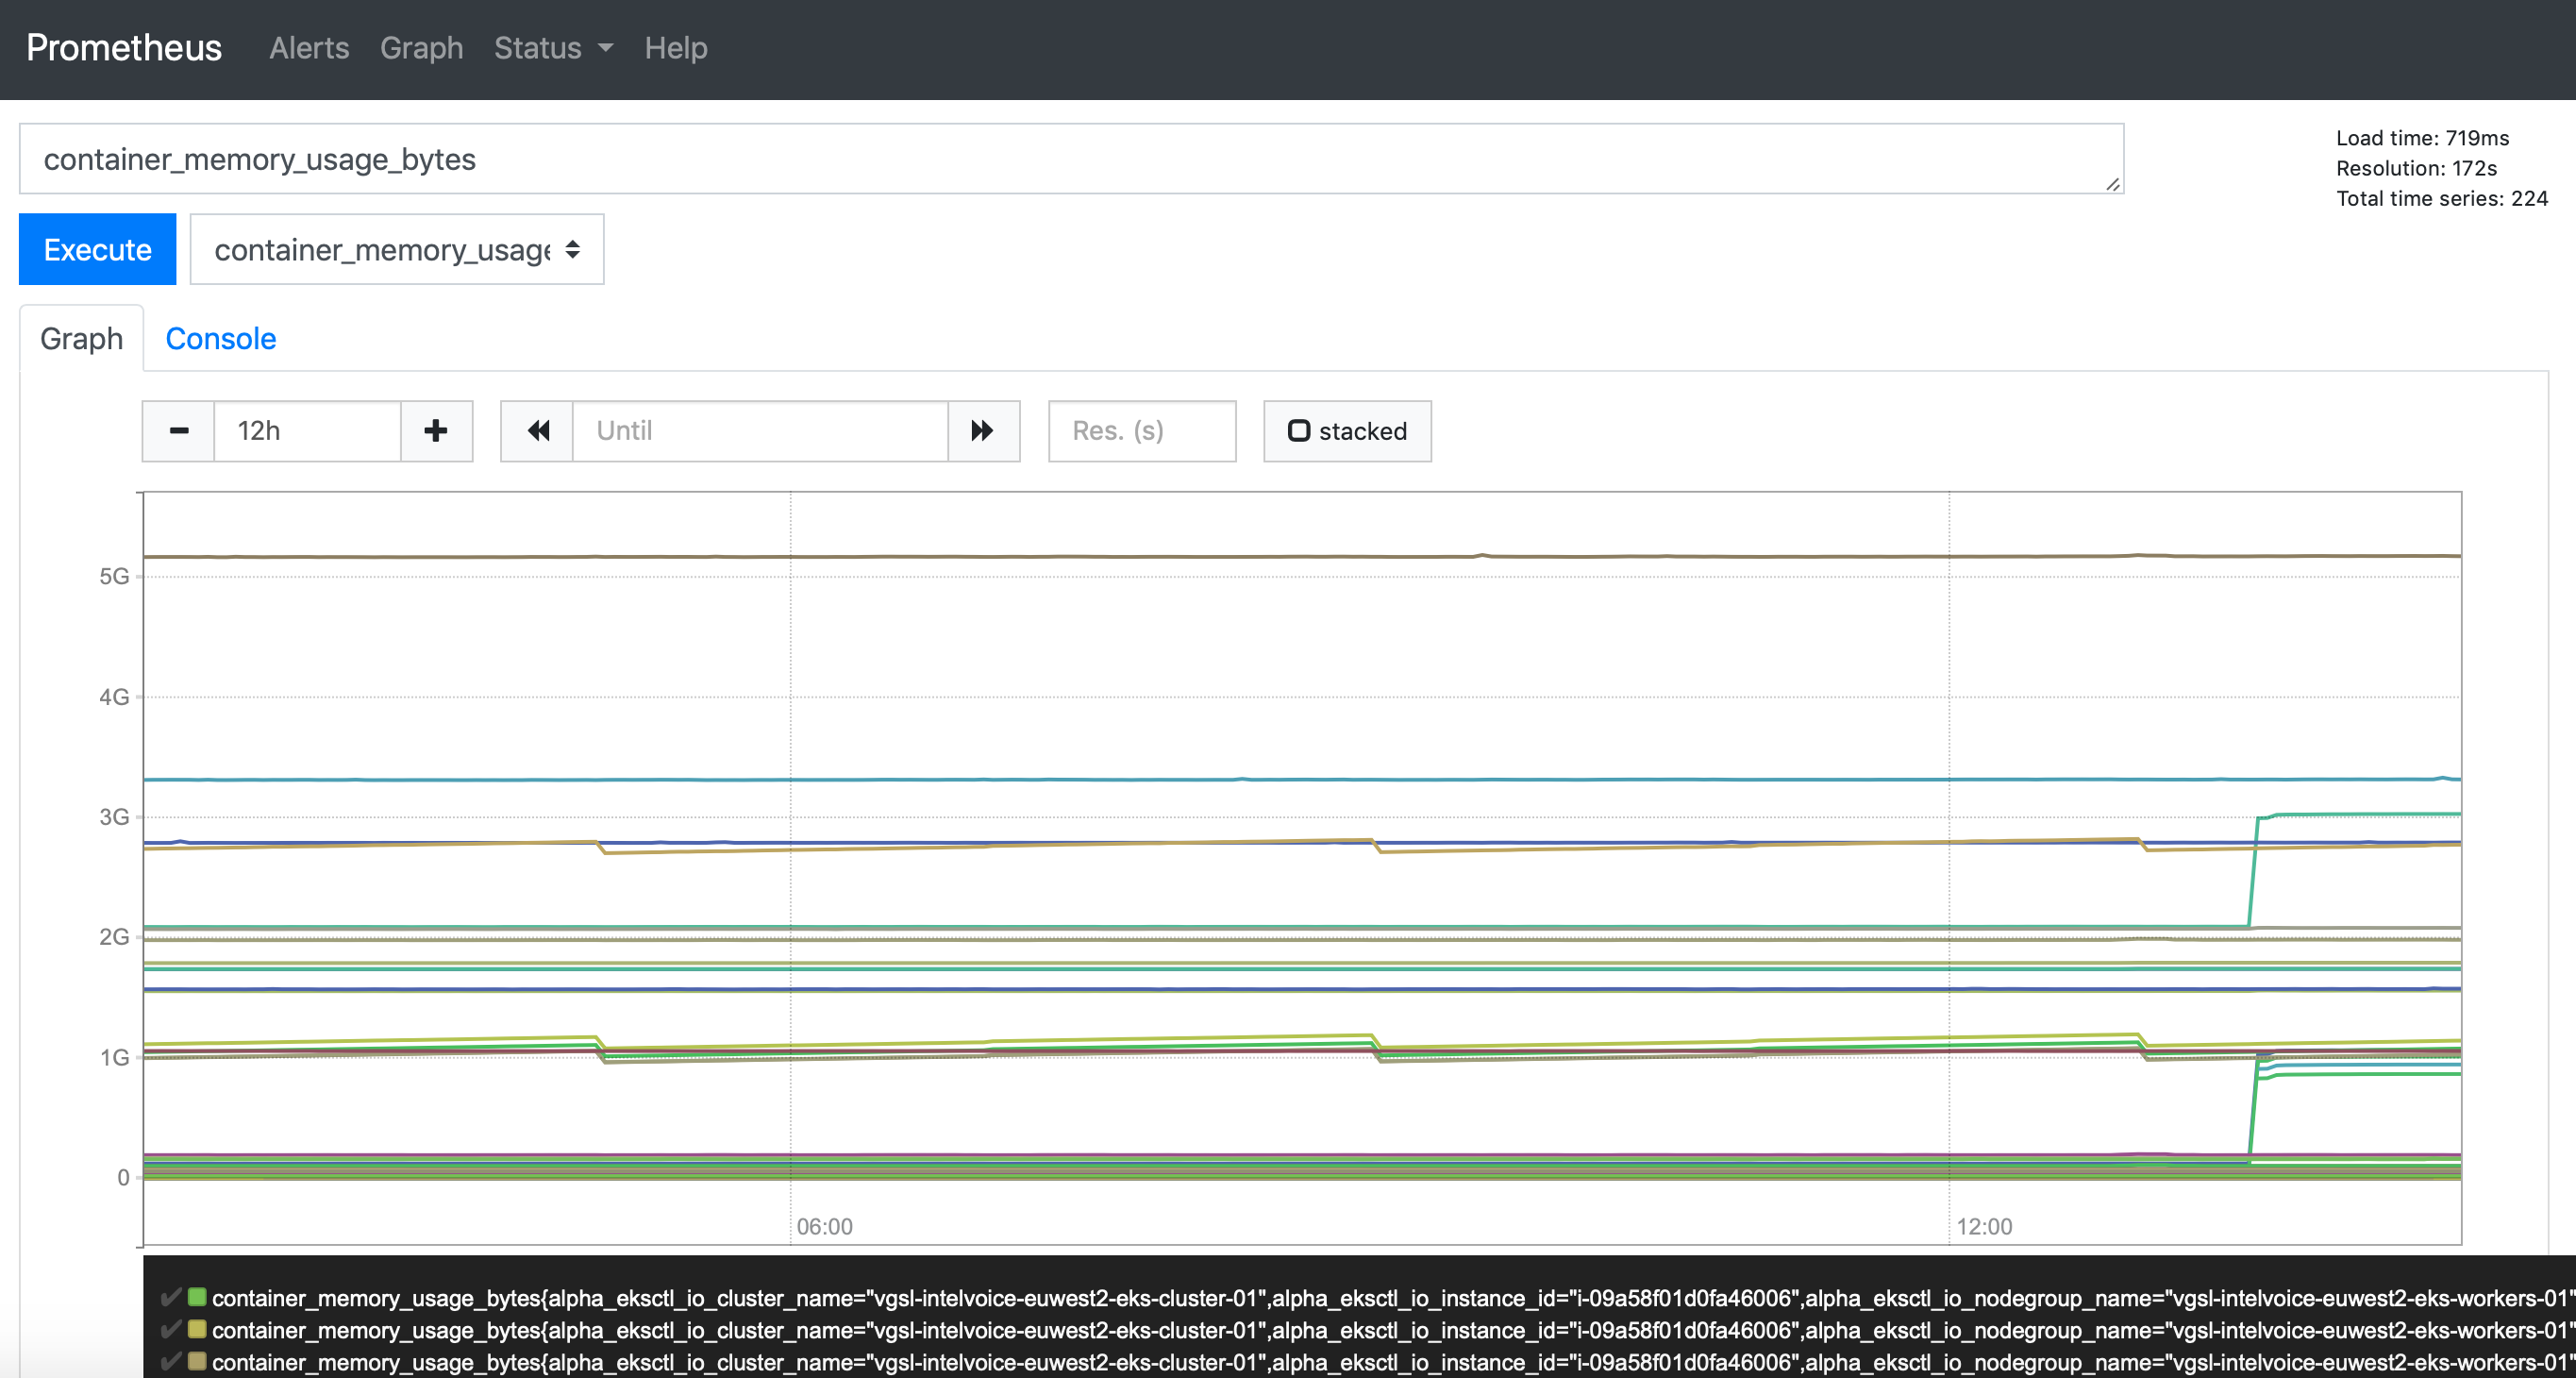
In most of the cases, Prometheus is deployed alongside with Grafana in order to provide an enhanced UI (see Grafana section below).
Installation
You can install Prometheus using Helm (https://github.com/helm/charts/tree/master/stable/prometheus).
helm Prometheus
kubectl create namespace prometheus
helm install stable/prometheus \
    --name prometheus \
    --namespace prometheus \
    --set alertmanager.persistentVolume.storageClass="gp2" \
    --set server.persistentVolume.storageClass="gp2"
In order to access the Prometheus server URL, we are going to use the kubectl port-forward command to access the application
kubectl port-forward -n prometheus deploy/prometheus-server 8080:9090
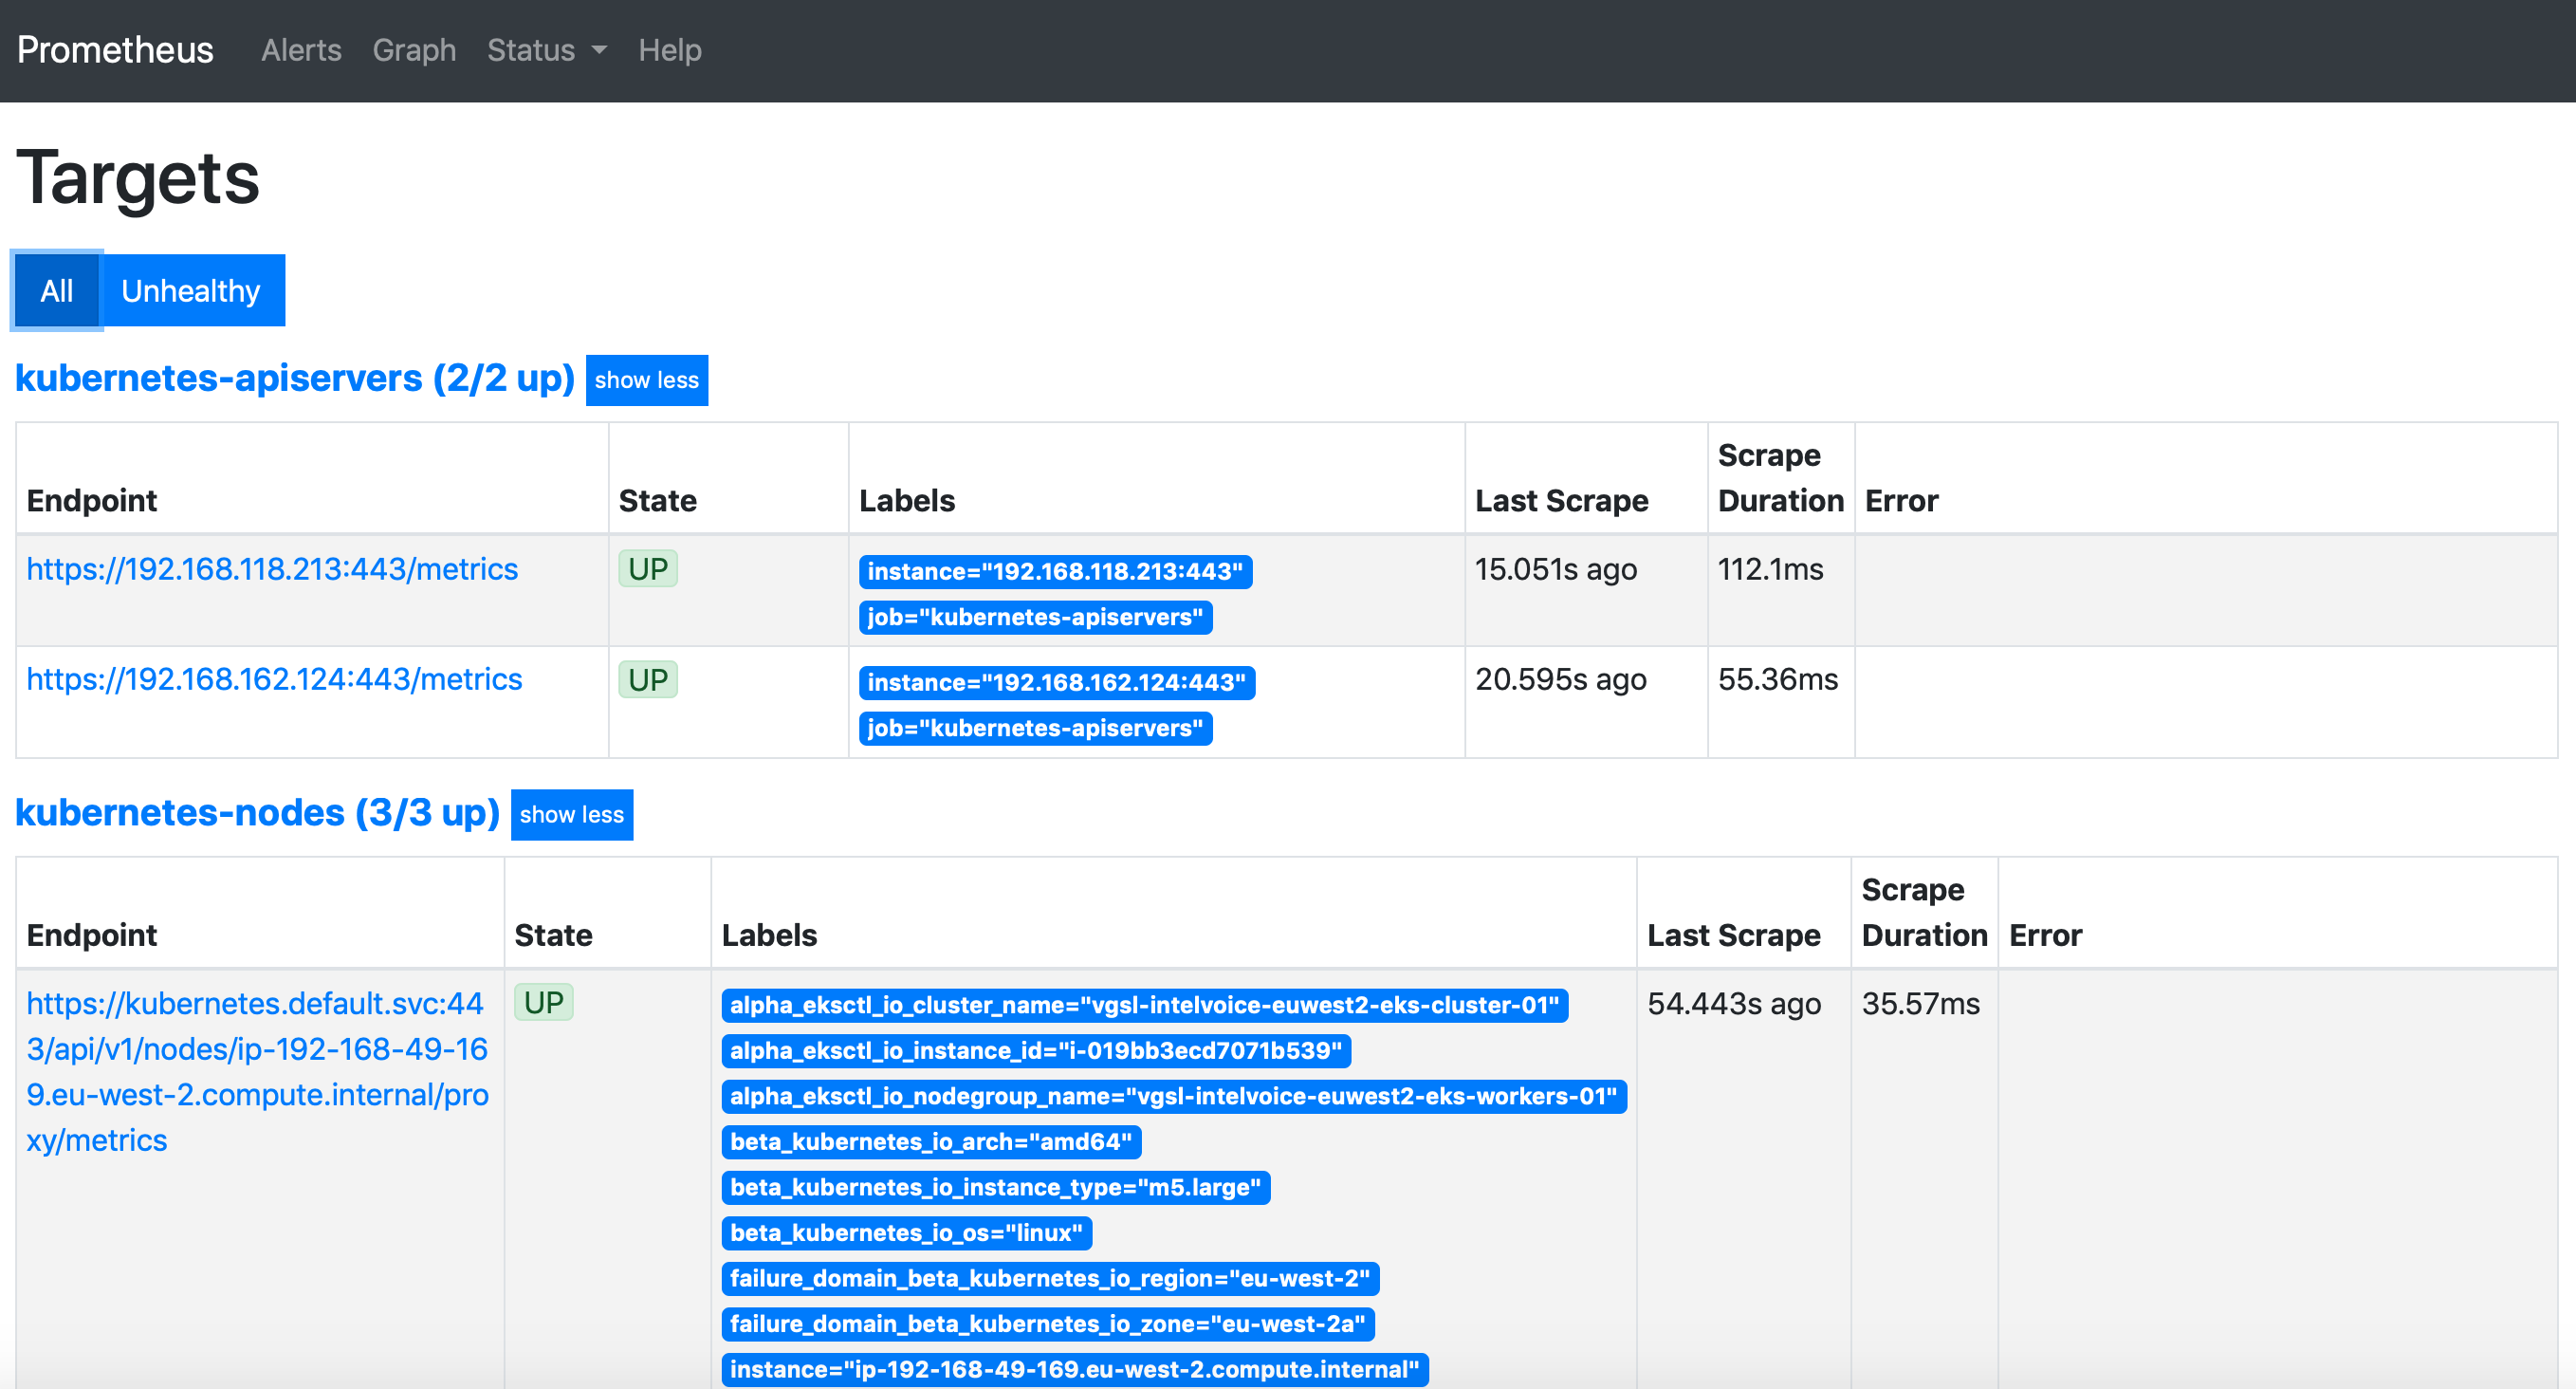
Browse the following URL: http://localhost:8080/targets/ , which displays the current targets.
Grafana
Grafana is an open source, feature rich metrics dashboard and graph editor. Grafana supports many different storage backends for your time series data (Data Source). Each Data Source has a specific Query Editor that is customized for the features and capabilities that the particular Data Source exposes. The following datasources are officially supported: Graphite, InfluxDB, OpenTSDB, Prometheus, Elasticsearch, CloudWatch. Once Grafana is deployed in the Kubernetes cluster, you can use the kubectl port-forward command to access the application.
kubectl port-forward -n grafana deploy/grafana 3000:3000
Browse the following URL: http://localhost:3000/ for accessing Grafana portal. The admin password is generated during the deployment. Run the following Kubectl command to retrieve it:
kubectl get secret \
--namespace monitoring grafana \
-o jsonpath="{.data.admin-password}" \
| base64 --decode ; echo
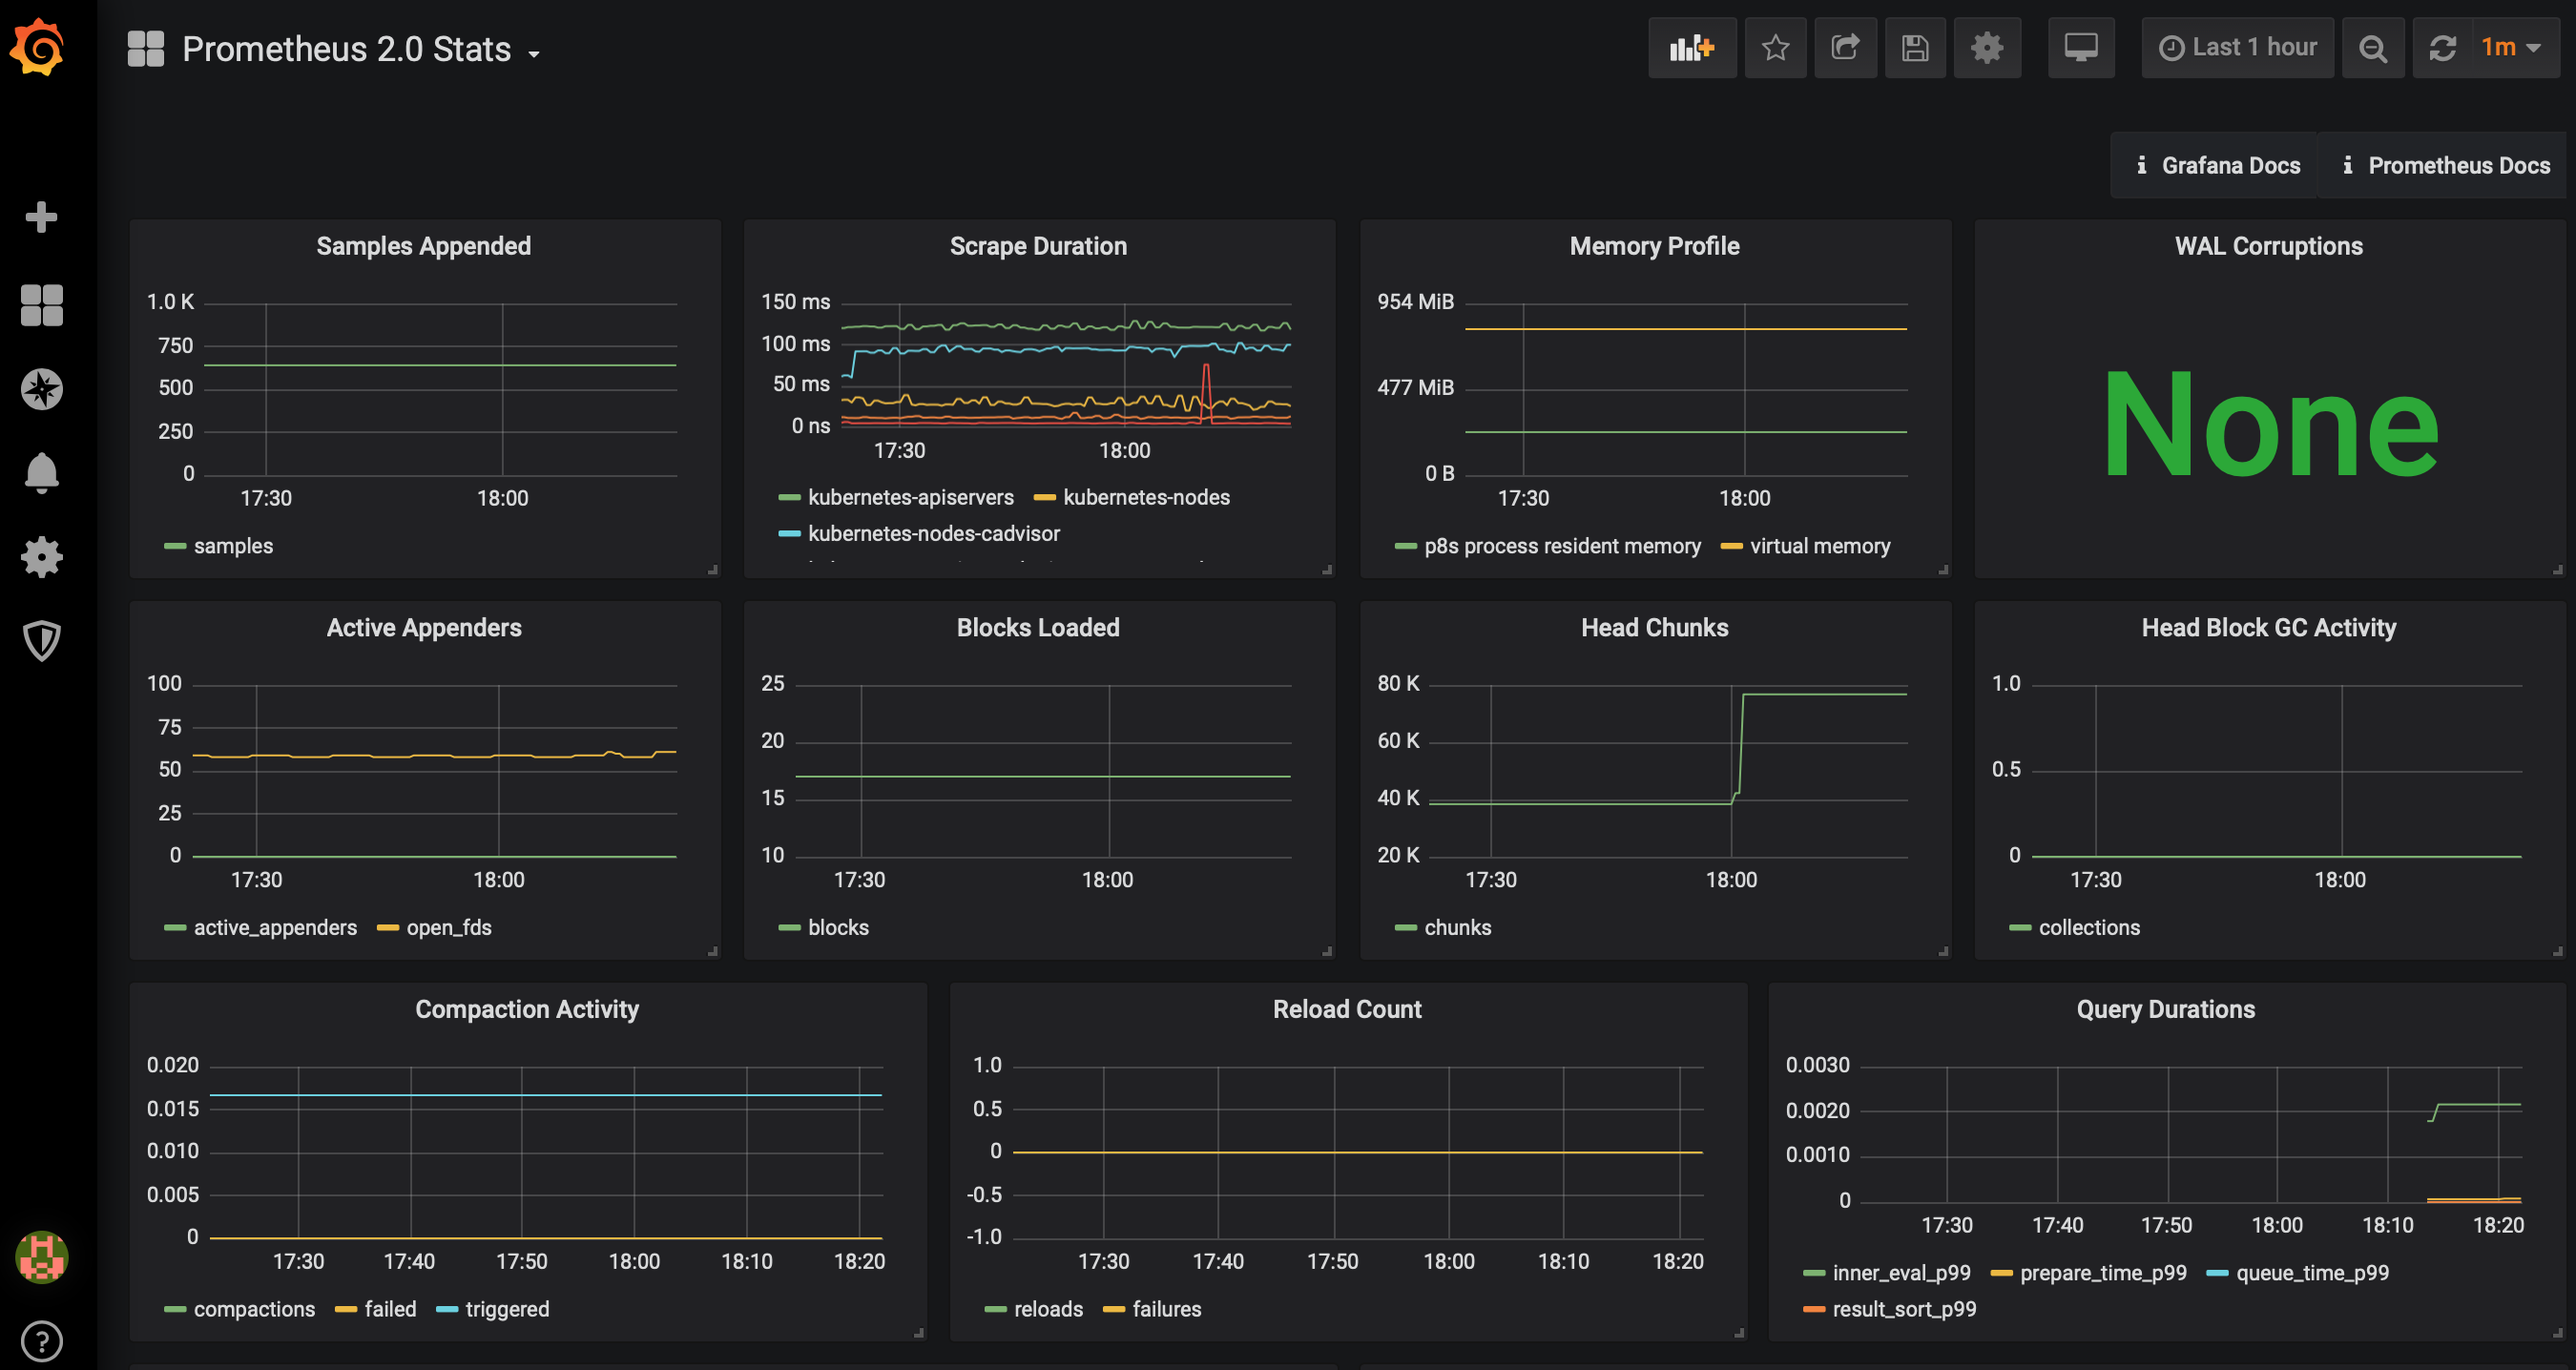
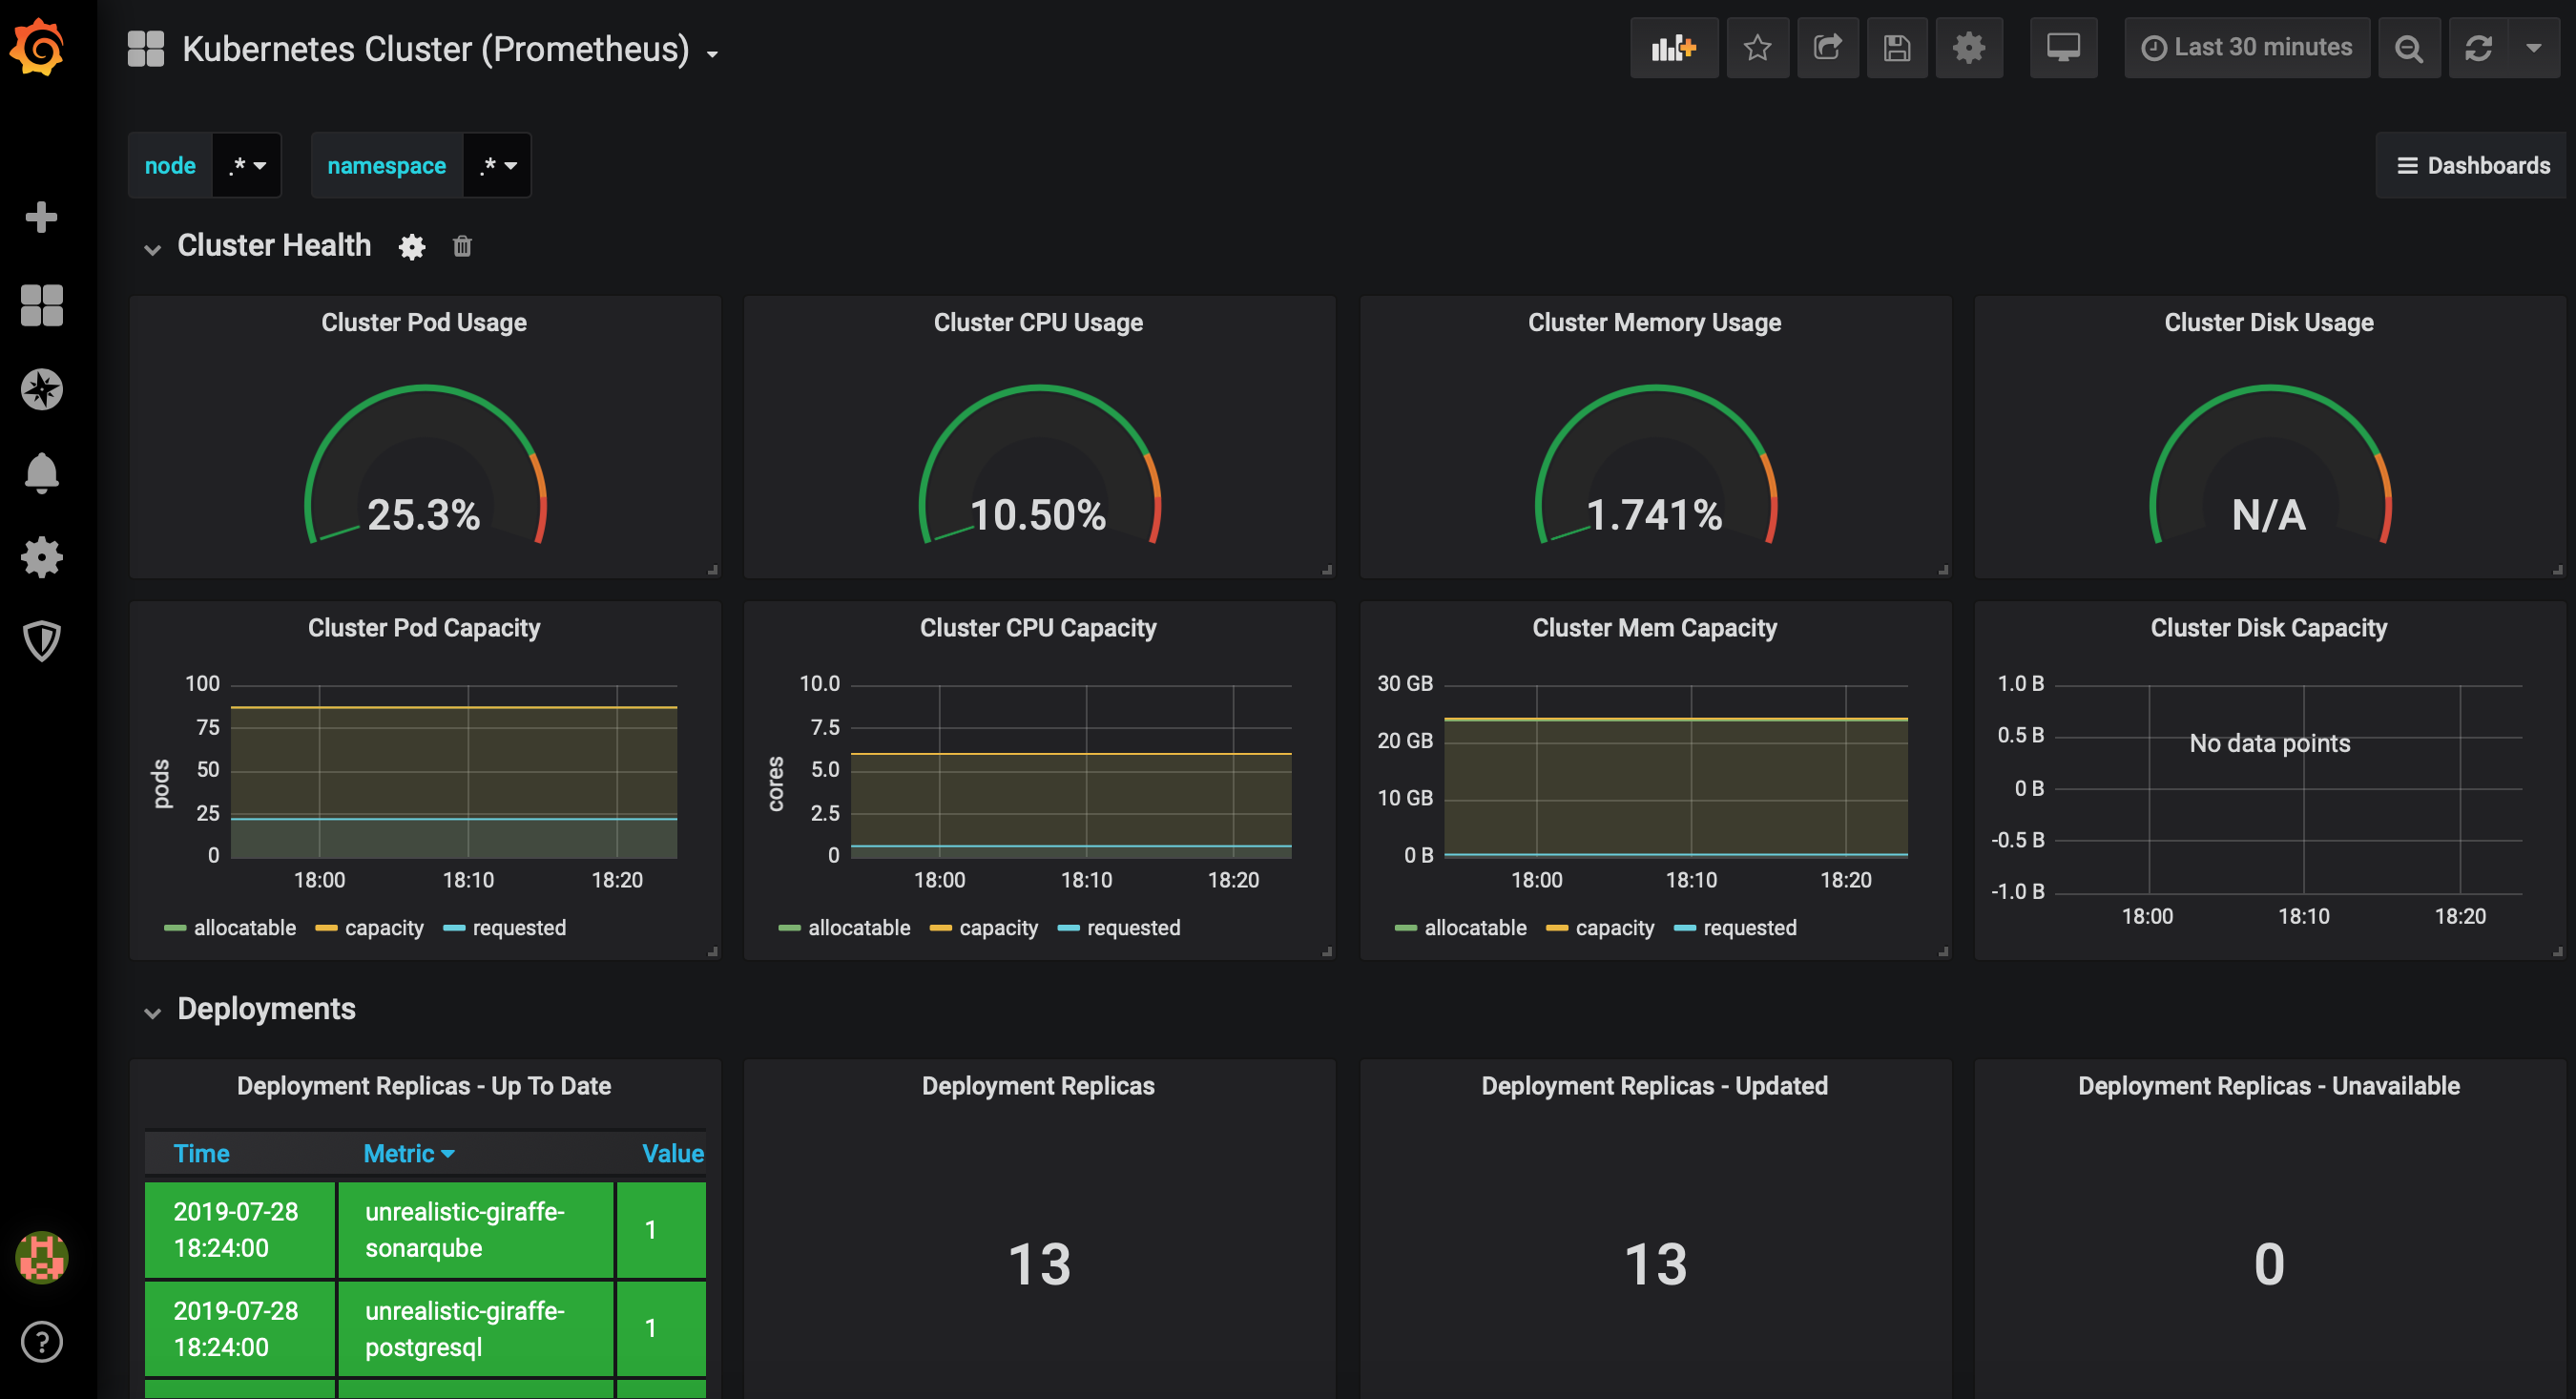
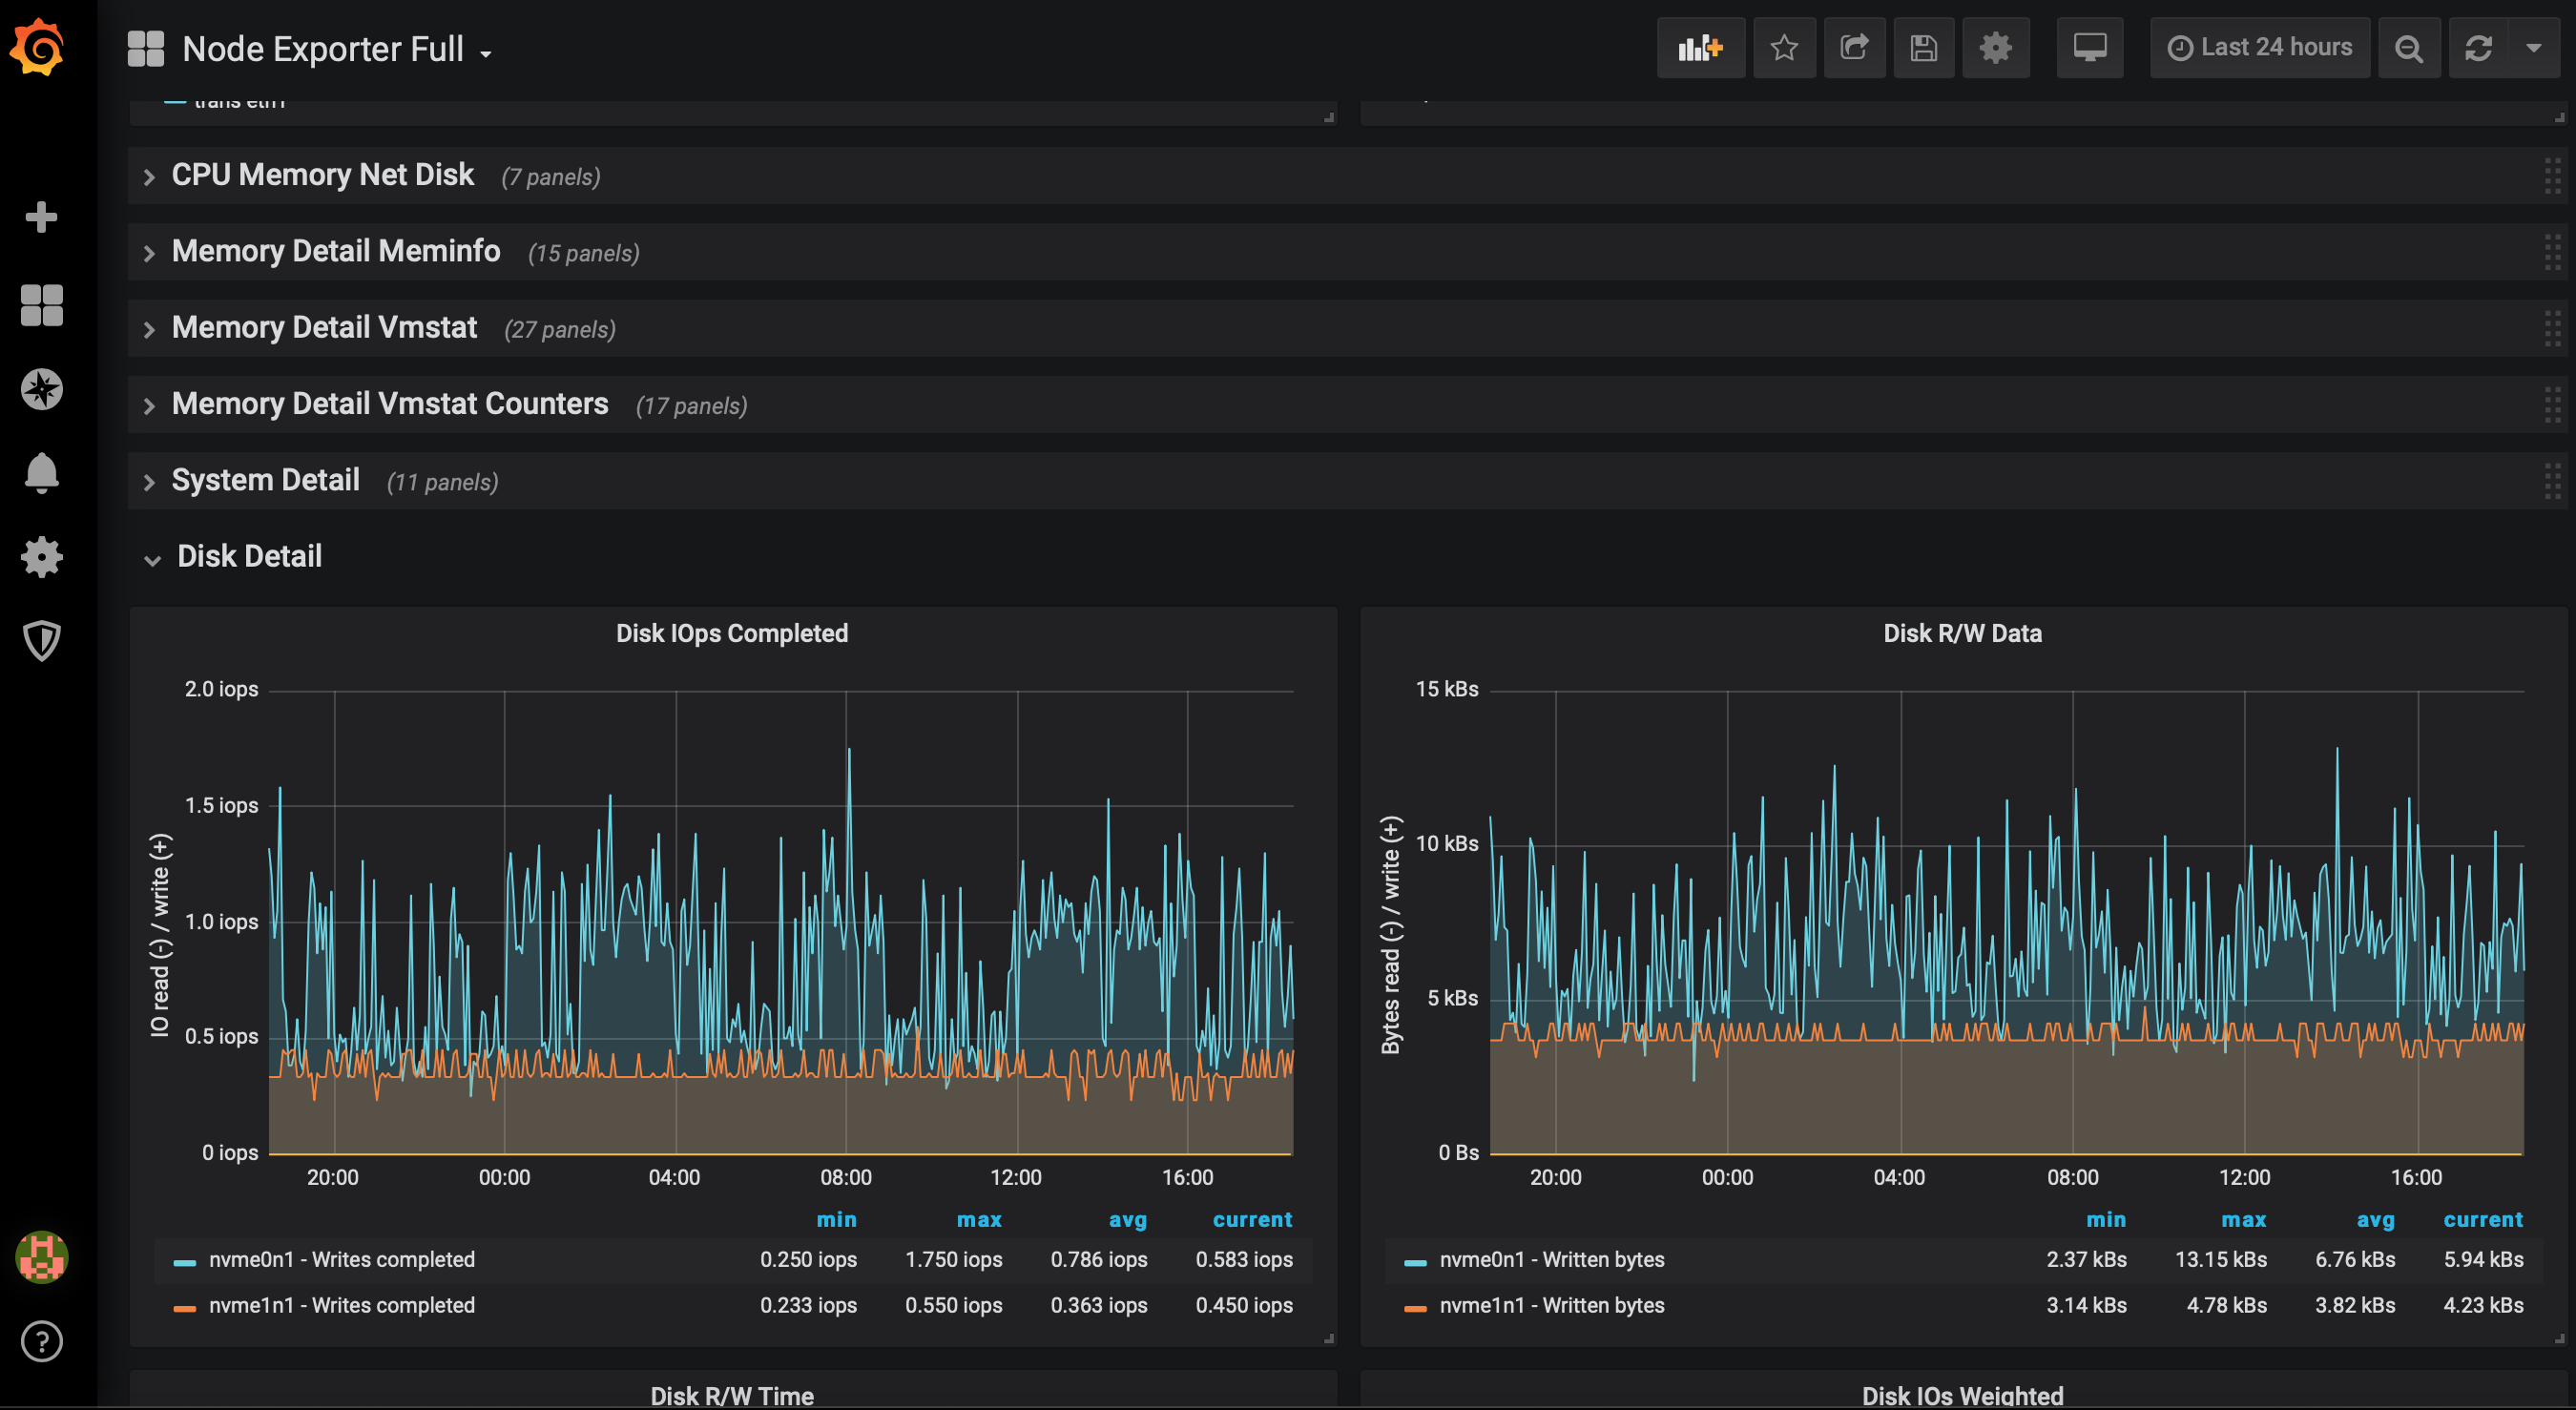
There are several dashboards, which can be added in order to monitor Prometheus and Kubernetes as shown below:
Kubernetes cluster details:
Cluster nodes details:
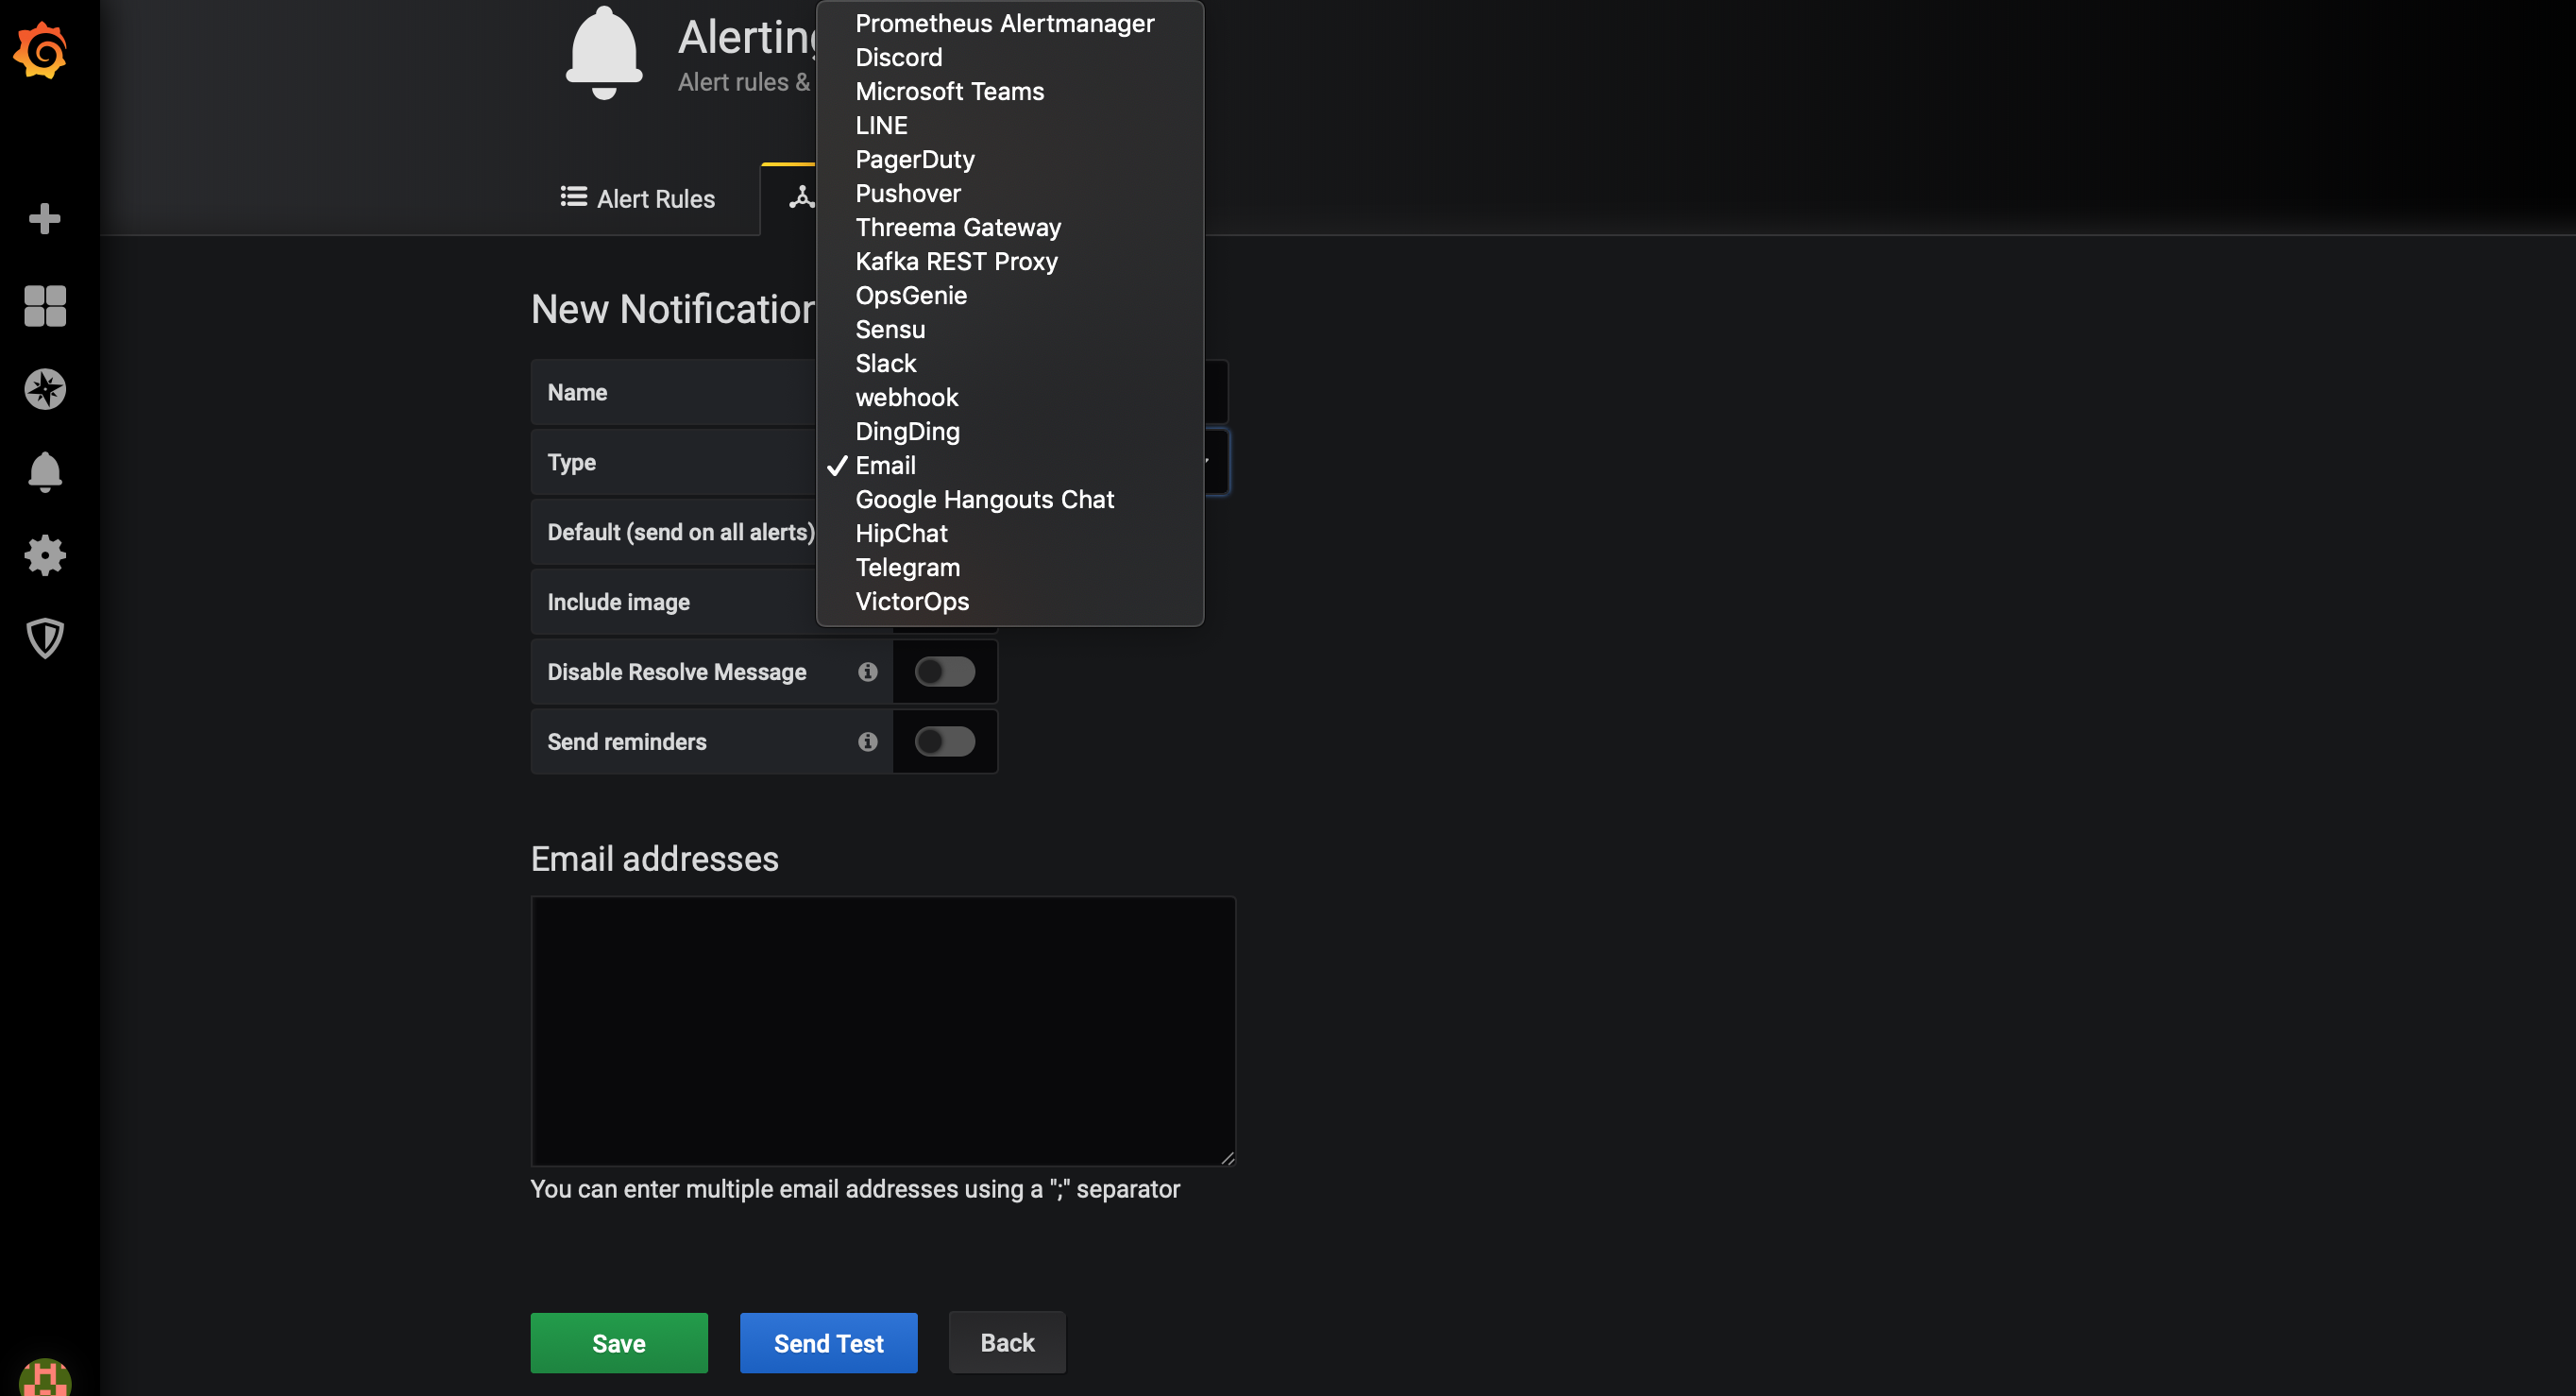
You can set up several notification channel such as email, webhook, Teams, Slack, etc. for the alarms:
