Monitoring with Graylog
Graylog is a powerful open source platform for management of both structured and unstructured data along with debugging applications.
Introduction
It is based on Elasticsearch, MongoDB, and Scala. Graylog has a main server, which receives data from its clients installed on different servers, and a web interface, which visualizes the data and allows to work with logs aggregated by the main server. Graylog Enterprise version is also available. Please refer to https://www.graylog.org/products/open-source-vs-enterprise
Graylog vs Elastic Stack
Graylog server combined with MongoDB and Elasticsearch, is often compared to the Elastic Stack (Elasticsearch, Logstash, and Kibana). Though both solutions are pretty similar in terms of features set, there are a few differences to consider. The most important distinction between the two lies in the fact that, from the very beginning, Graylog is positioned as a powerful logging solution, while ELK is a Big Data solution. Graylog can receive structured logs and standard syslog directly from an application through the network protocol. On the contrary, ELK is the solution that analyzes already collected plain text logs using Logstash and then parses and passes them to ElasticSearch. In ELK, Kibana plays the role of a dashboard and displays the data received from Logstash. Graylog in this sense is more convenient as it offers a single-application solution (excluding ElasticSearch as a flexible data storage) with almost the same functionality. So the time needed to deploy a usable solution is smaller.
Installation
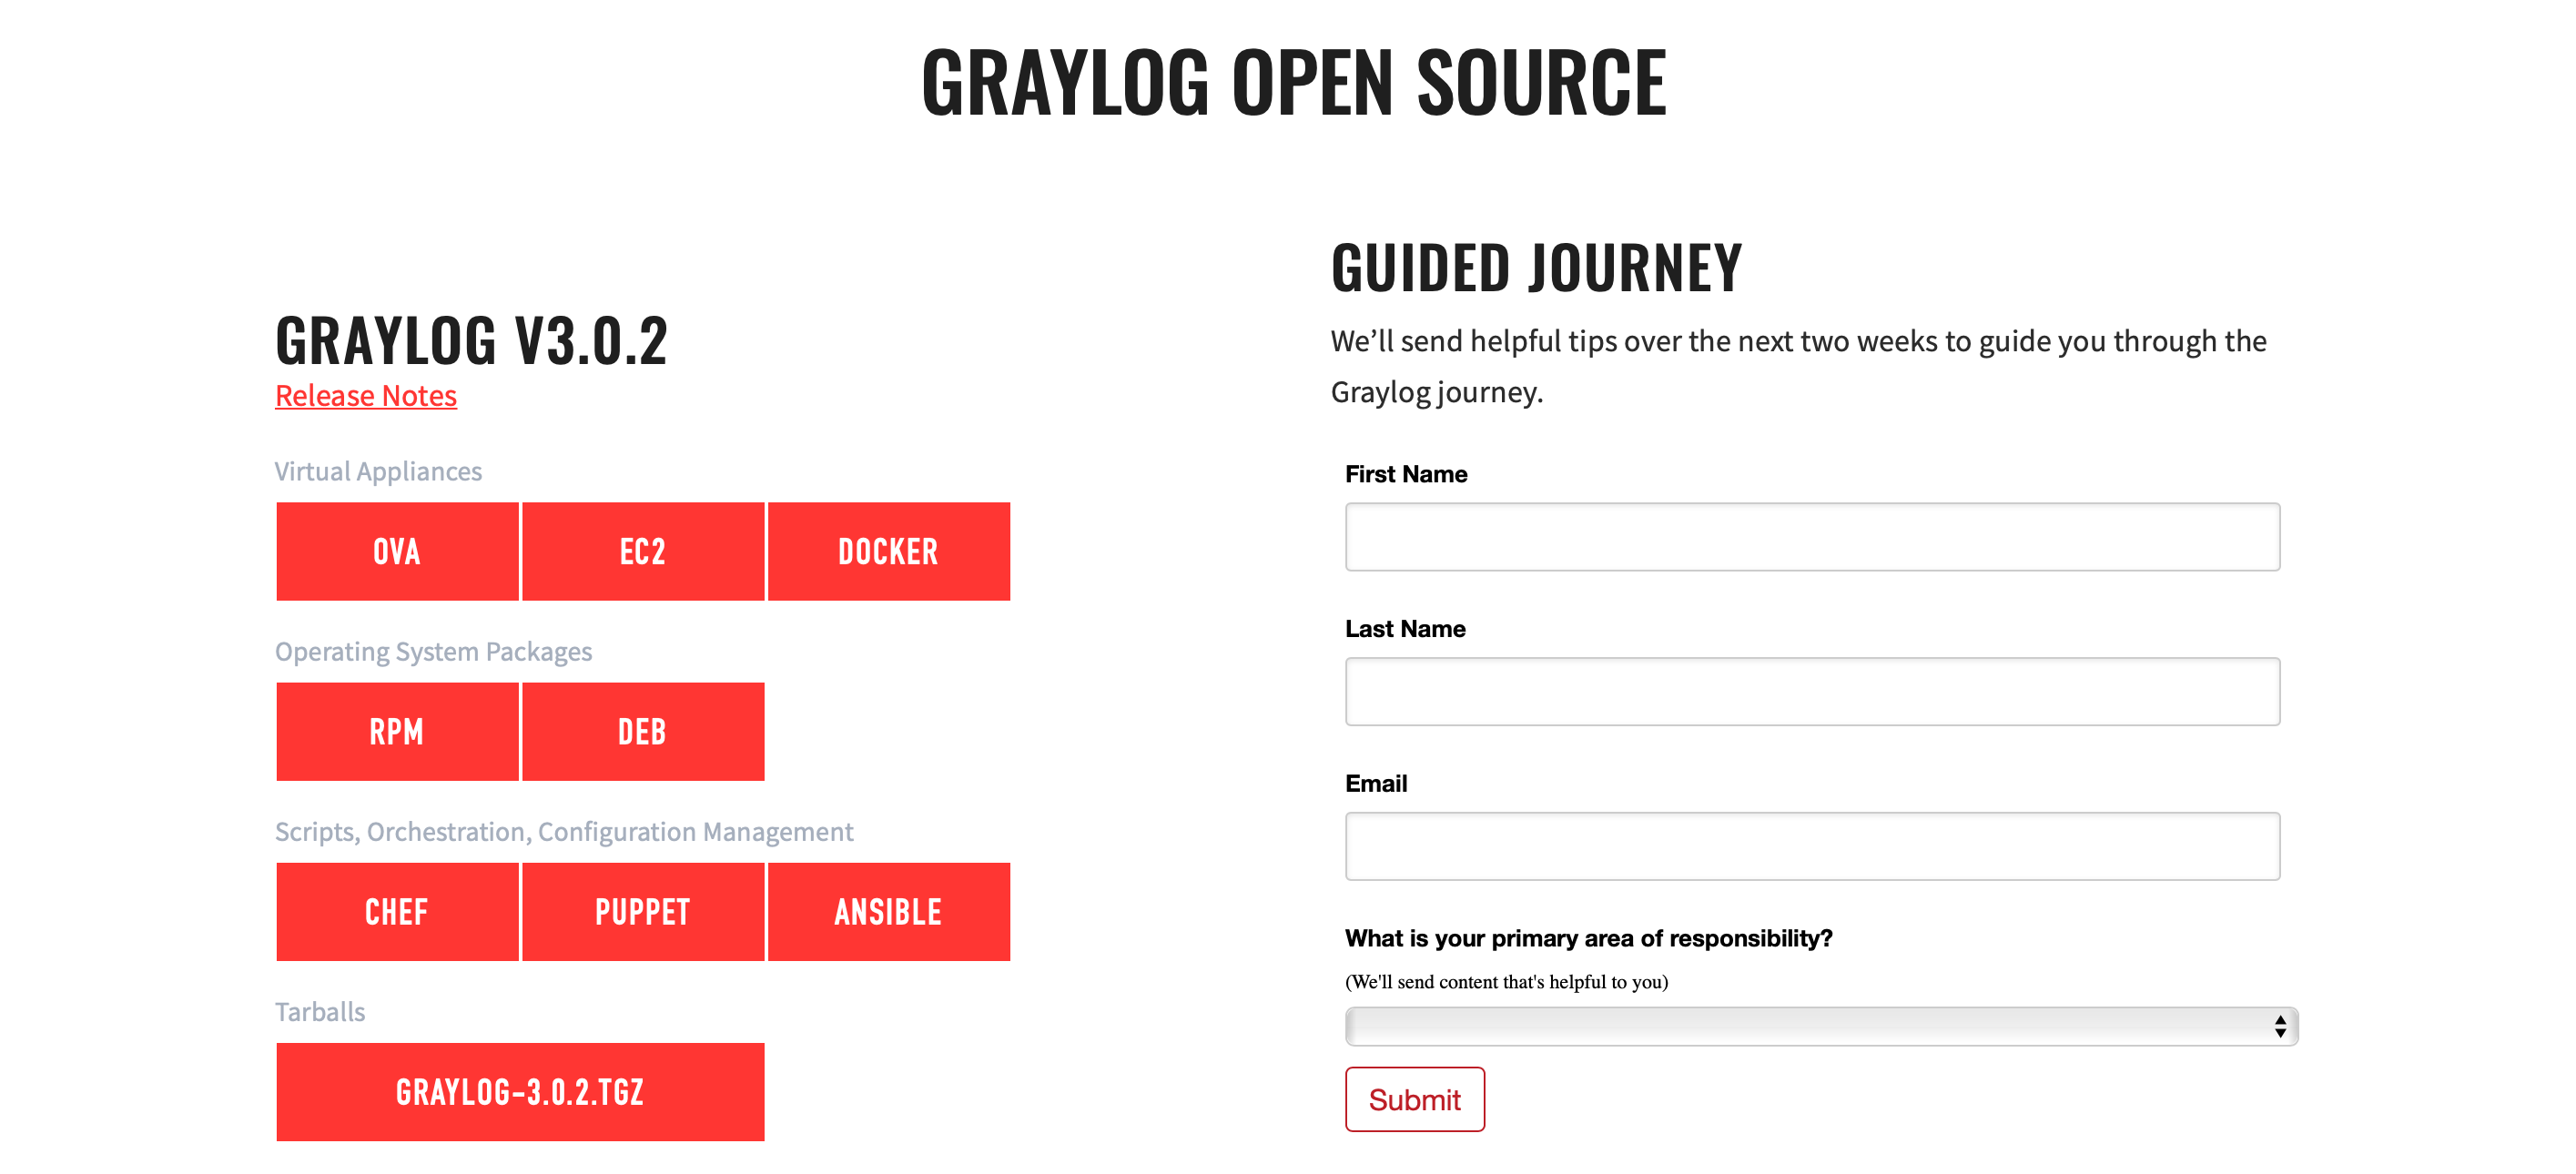
Graylog open source is bundled in many formats, such as OVA, AWS EC2, Docker, rpm, etc.

In this case, we opted for running the demo on top of an EC2 instance.
Configuring Graylog
Once the EC2 is launched, create a password of at least 64 characters by running the following command:
pwgen -N 1 -s 96
Copy the result referenced below as password Let’s create its sha256 checksum as required in the Graylog configuration file:
echo -n password | sha256sum
Now you can open the Graylog configuration file:
sudo vi /etc/graylog/server/server.conf
And replace password_secret and root_password_sha2 with the values you created above. Run the following commands to restart Graylog:
sudo systemctl daemon-reload
Getting Started
Browse your EC2 public dns name and sign in with the credentials created above.

Create Input for receiving syslog
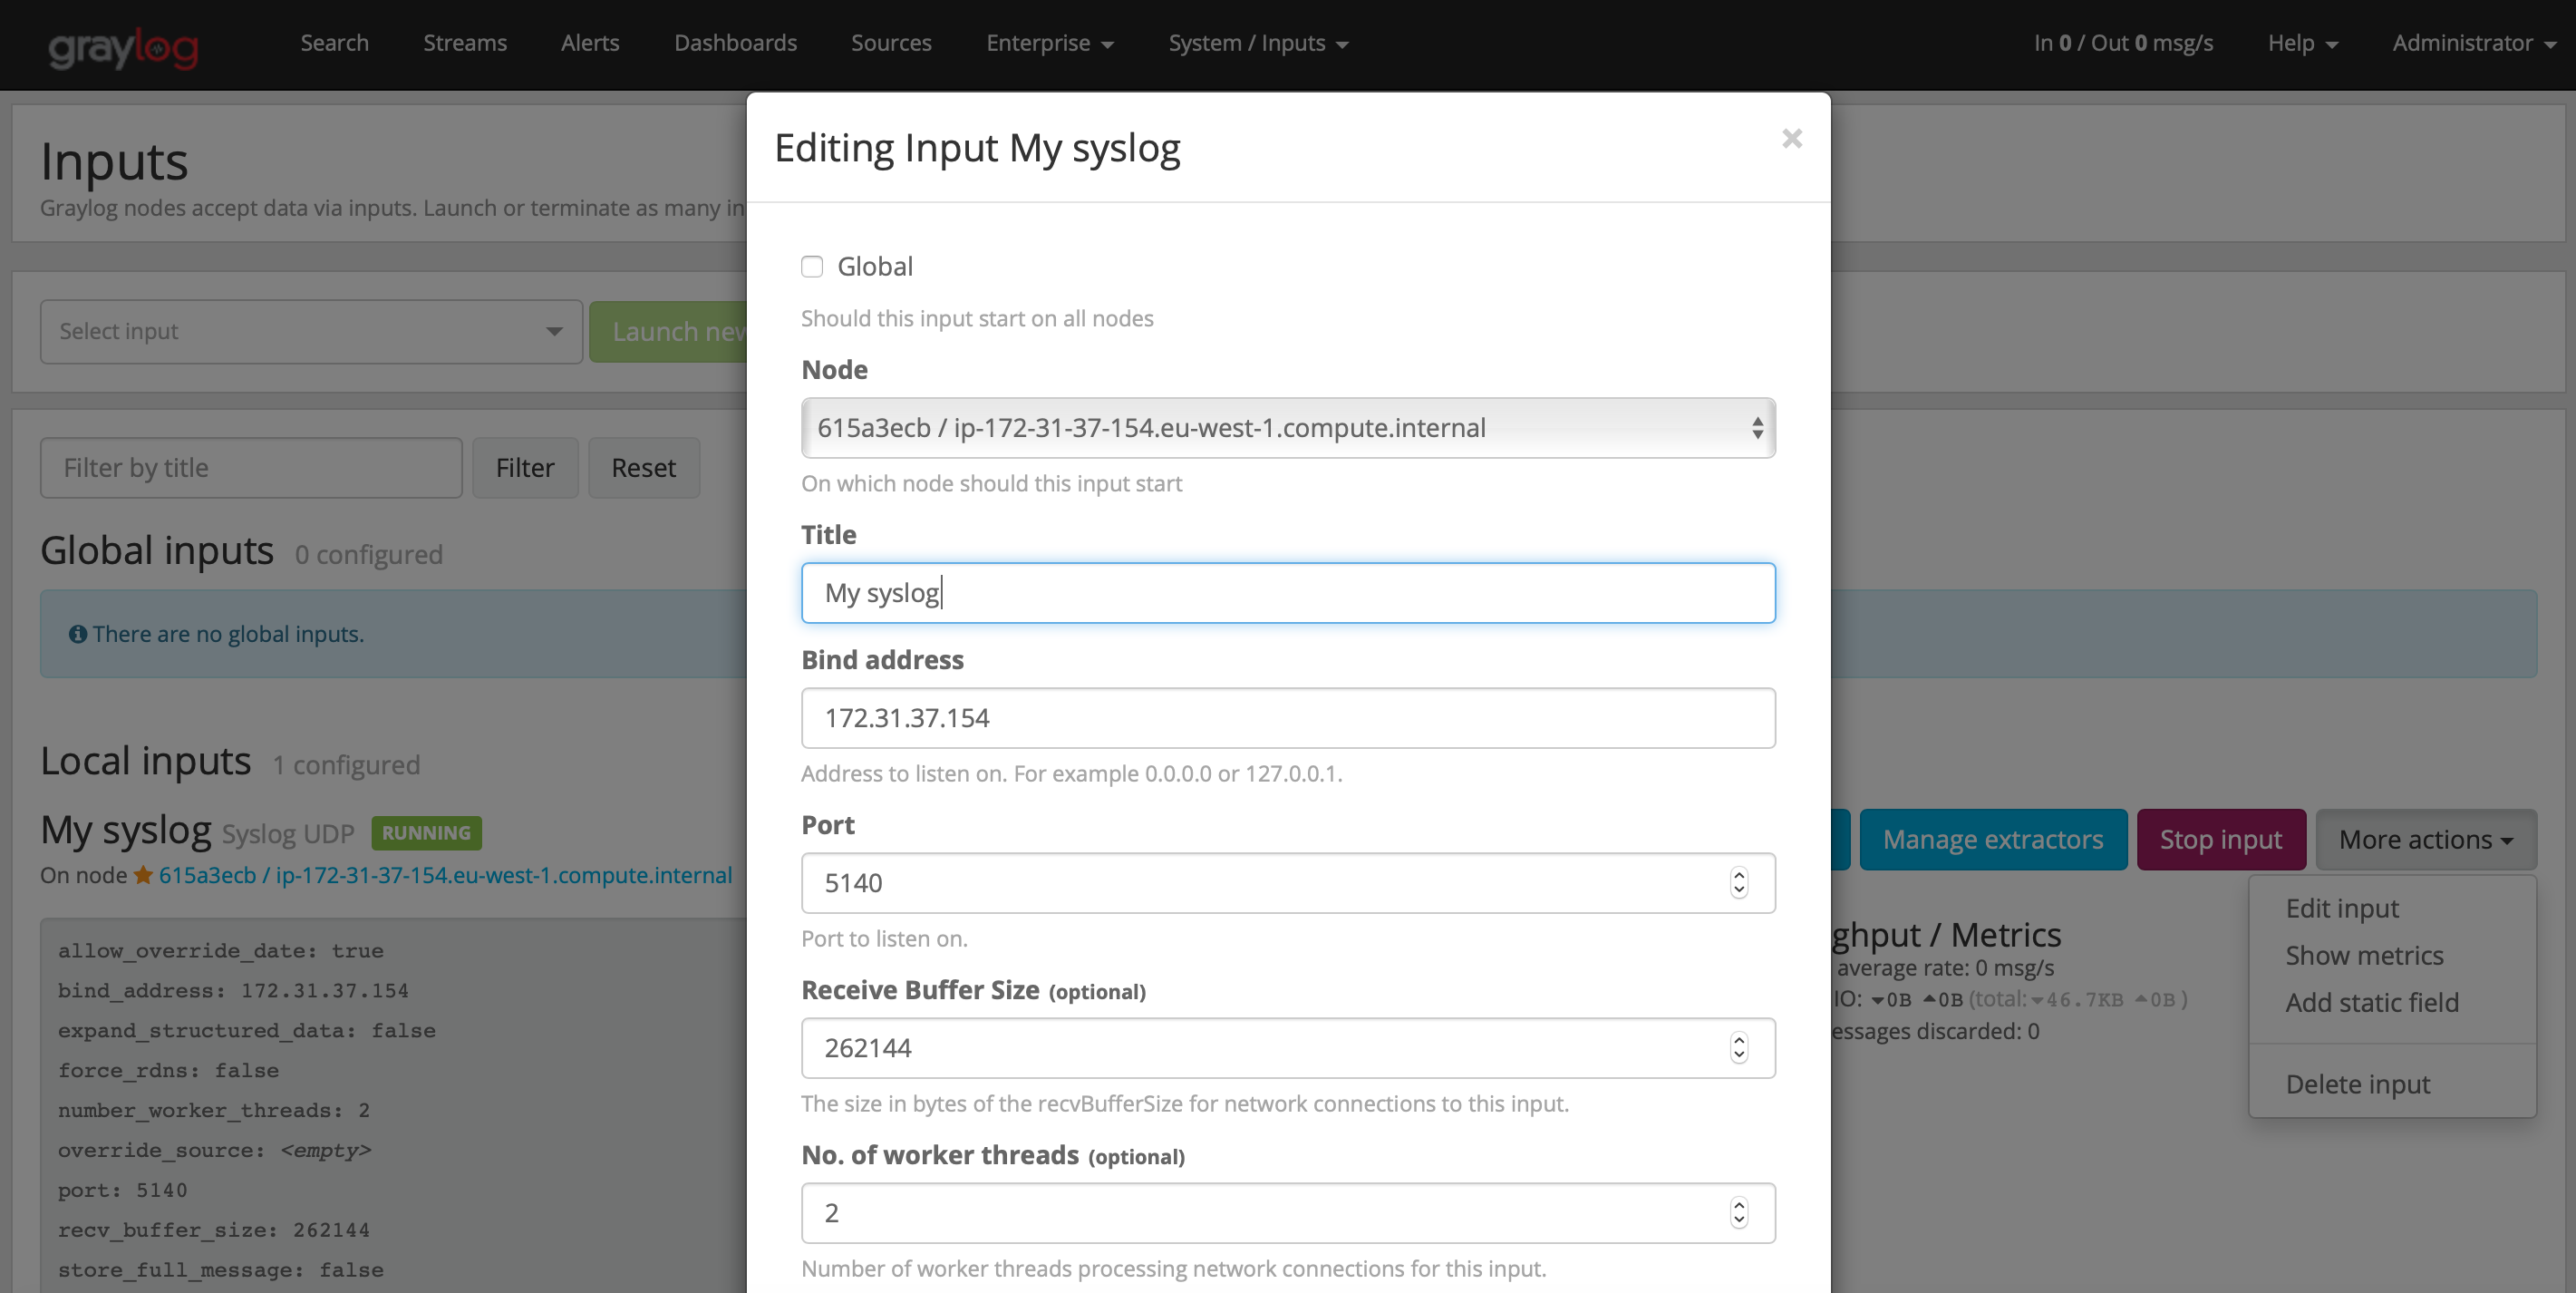
You need to create inputs in order to send log data from client to Graylog server. After creating an input, a corresponding service will start listening in a port through which the clients can send logs to. To create an input, click on System > Inputs.

Enter the information as below
Node: <Select from dropdown>
Title: syslog
Port: 5140
Bind address: <graylog_private_IP>
Configure the EC2 instance to send syslog messages to Graylog.
Create an rsyslog configuration file in /etc/rsyslog.d. sudo vi /etc/rsyslog.d/90-graylog.conf
Add the following lines to configure rsyslog to send syslog messages to Graylog server
*.* @172.31.37.154:5140;RSYSLOG_SyslogProtocol23Format
where 172.31.37.154 is the private IP of the EC2 instance Graylog server.
Restart rsyslog for the change to take effect.
systemctl restart rsyslog
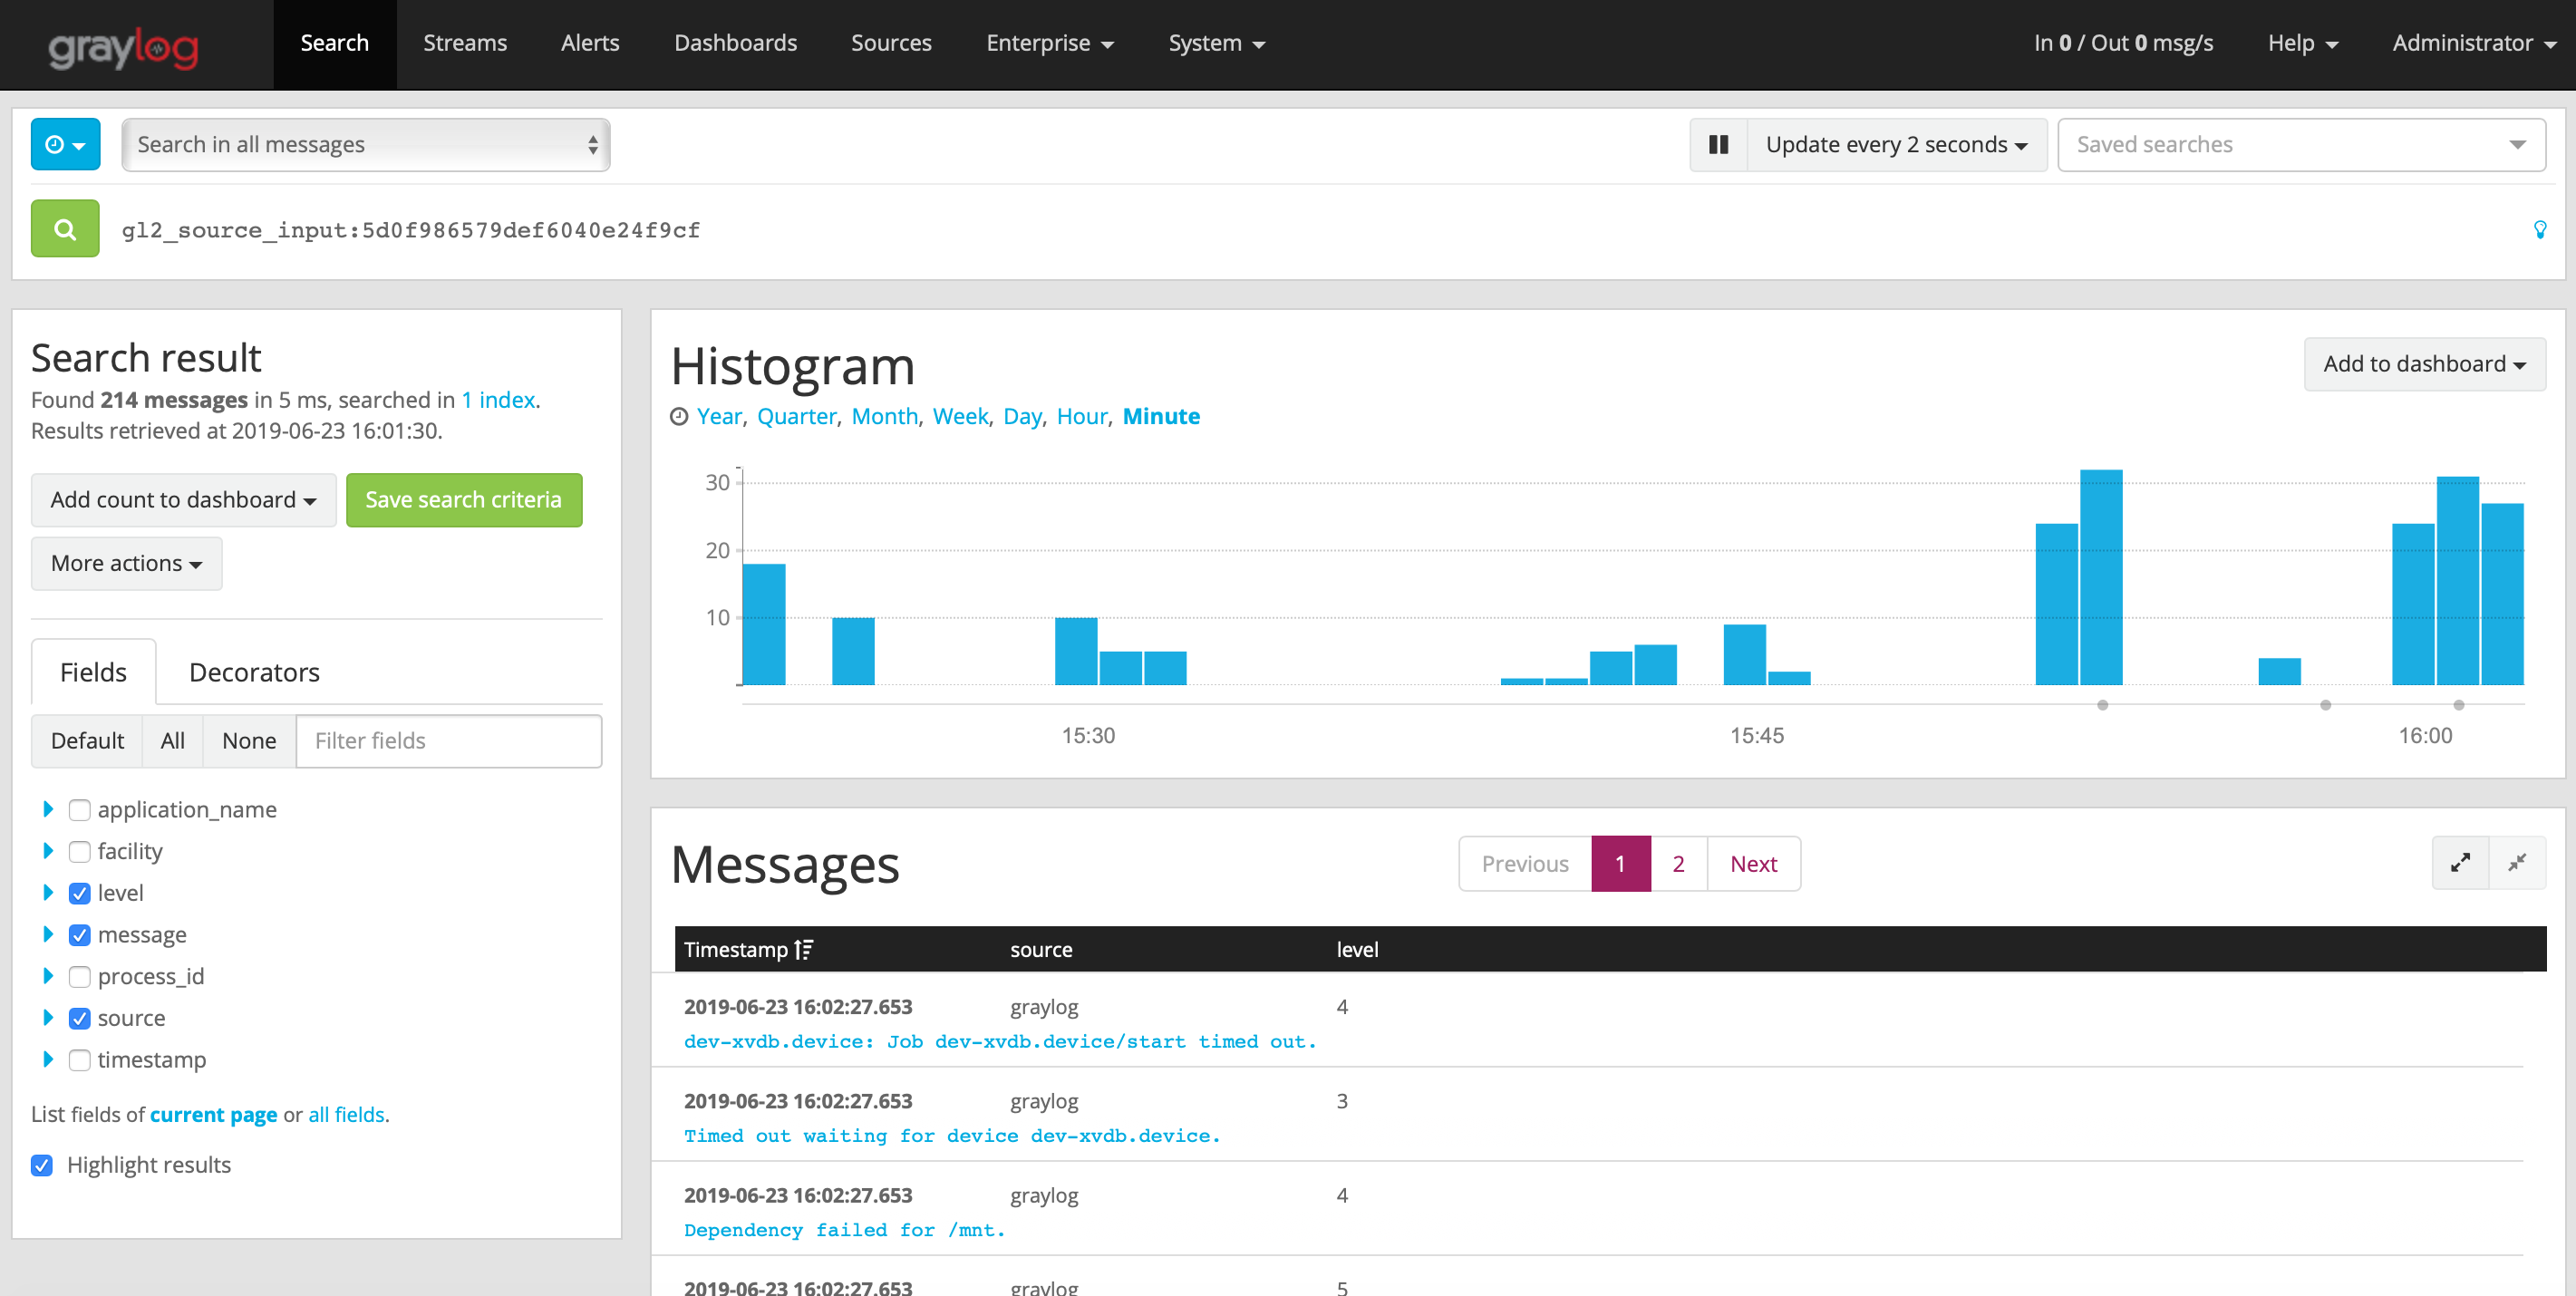
You can see how Graylog has parsed the logs with different fields by clicking on the individual messages.
Dashboards
Graylog provides a dashboard feature to add several widgets.

Alerts
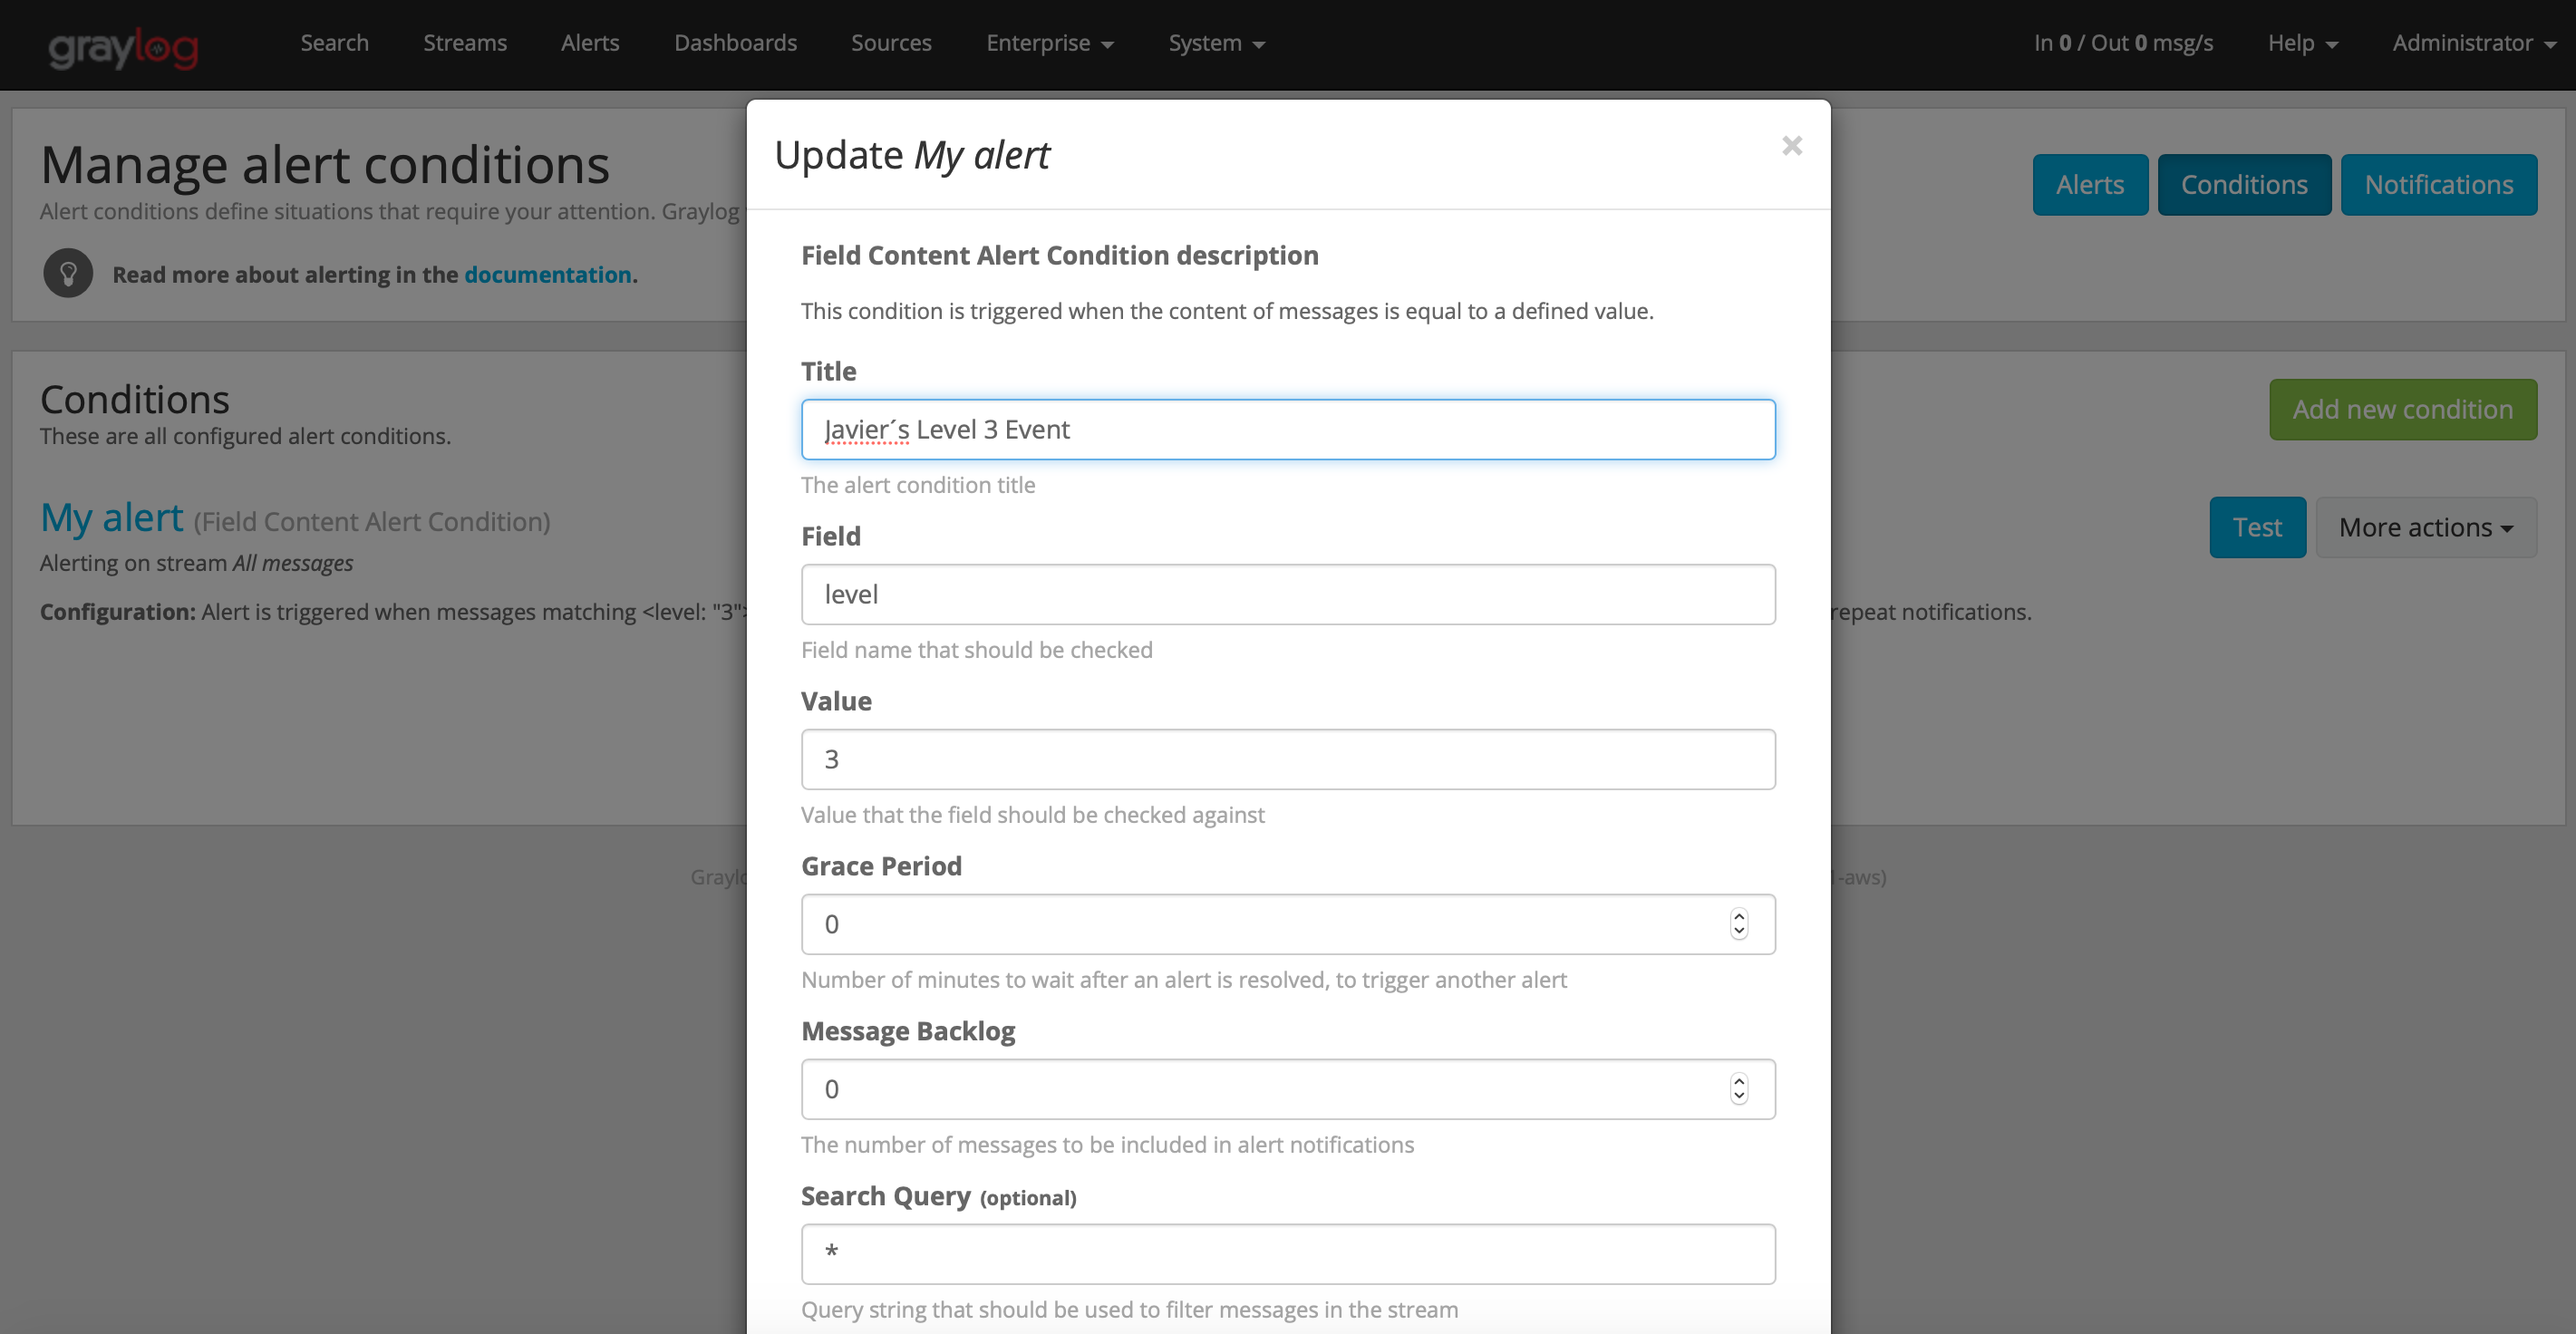
You can configure alerts and notification in order to monitor your platform. There are many types of conditions to configure Graylog to use to initiate alerts. The simplest is a field content condition, I used for this demo below. Click on Alerts in the top menu. Click on Conditions. Click on Add new condition.

Select your stream from the ‘Alert on stream’ dropdown menu. Select ‘Field Content Alert Condition’ in the ‘Condition type’ dropdown menu. Click ‘Add alert condition’
Choose a condition title, the Field that should be selected (in my case, Level), and the Value for which you want to receive alerts. You may want to set a value for Grace Period in order to keep from receiving multiple alerts for a condition occurring multiple times in quick succession, and for ‘Message Backlog’ in order to see messages which may have occurred before the condition for the alert was met included in the alert for that condition. Click Save.
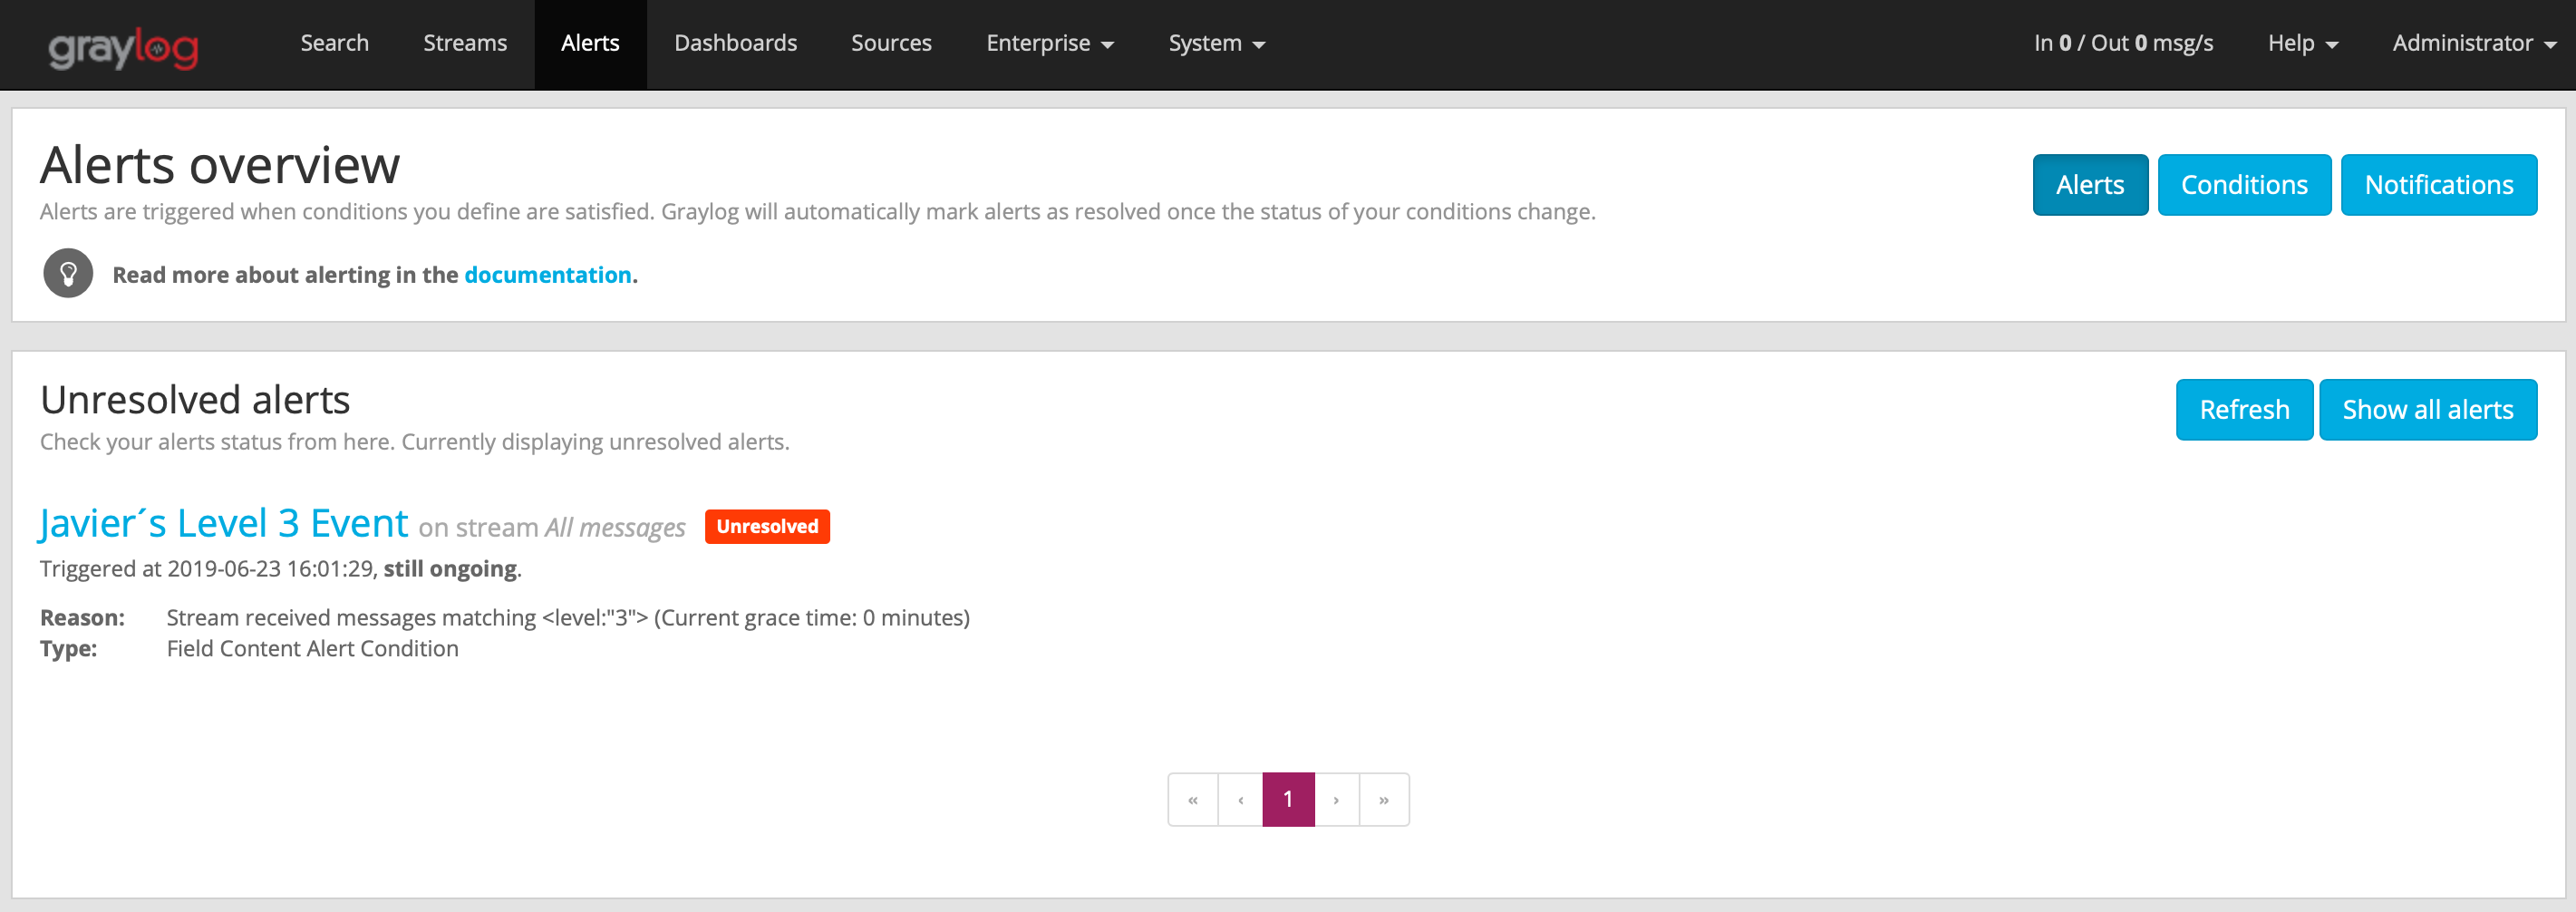
I am going to restart syslog in order to force a new level=3 event.
systemctl restart rsyslog
The alert is displayed as unresolved.
Notifications
You can configure notification to be sent in the event of an alarm. Firstly, you must configure your server to allow email to be sent from Graylog. Open /etc/graylog/server/server.conf in a text editor, find and uncomment the following lines and configure them appropriately.
In this case, configure the Email transport settings:
transport_email_enabled = true  # Enable it!
transport_email_hostname = smtp.gmail.com # I am using Gmail server
transport_email_port = 465
transport_email_use_auth = true
transport_email_use_tls = true
transport_email_use_ssl = true
transport_email_auth_username = your_email_account@gmail.com #This is an account you created for the purpose of sending automated emails
transport_email_auth_password = your_password
transport_email_subject_prefix = [graylog]
transport_email_from_email = graylog@example.com
Once you finish the above, close the text file and run:
sudo systemctl graylog-server restart
Click on Manage notifications > Add new notification. Select your stream from the ‘Notify on stream’ dropdown menu. Choose Email Alert Callback from the Notification type dropdown menu. Click on Add alert notification.
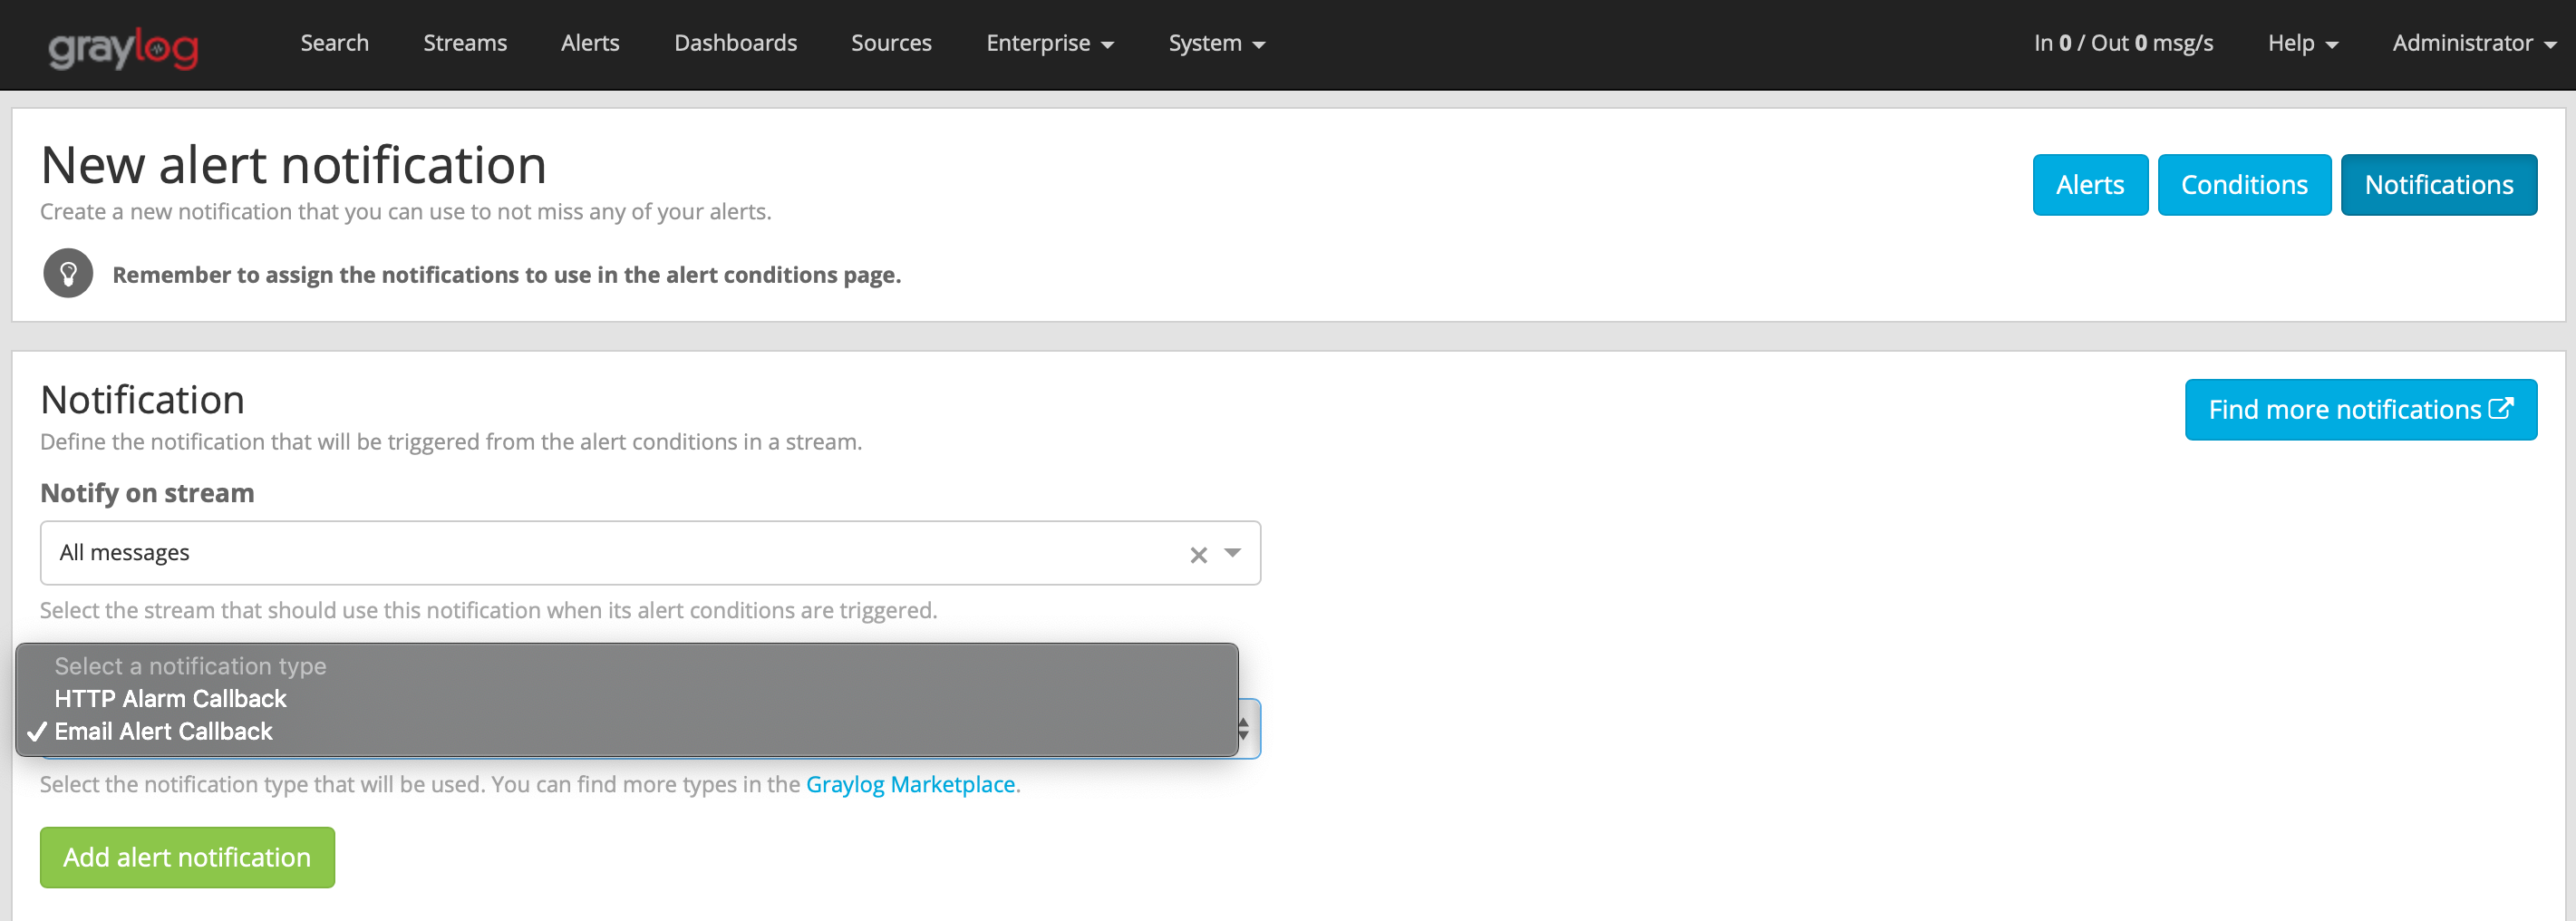
In the dialog pop-up window that appears, give your Email Alert a title, subject including variables to inject information from the stream and condition and sender email address. Default values for Subject and Body contain template placeholders for information about the condition and alert, which should be sufficient in most cases. Click Save.
Documentation
Please refer to https://docs.graylog.org/en/3.0/index.html